Most traders love chasing green candles. Professionals study pullbacks — because they reveal who’s really in control.
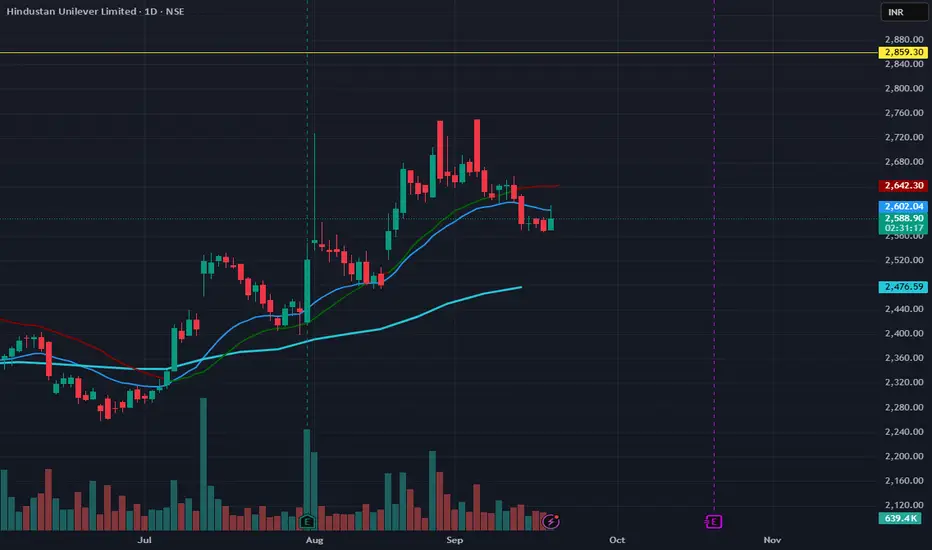
🔎 What the Chart Shows (HUL)
Strong run-up July–Aug → clear trend.
Recent pullback into 2600 zone.
20 & 50 MA curling sideways → buyers losing some steam.
200 MA still rising → long-term trend intact.
✅ How to Use This
Weak pullback (low volume, shallow retrace): Often resumes trend.
Strong pullback (heavy selling, breaks 50MA): Trend shift risk.
Here → buyers defending near ₹2,590–2,600. A bounce above ₹2,642 could confirm strength.
👉 Lesson: Don’t fear pullbacks — read them. They tell you if trend is resting or reversing.
💡 Save this chart. Follow for daily technical education with trader psychology.
Started like everyone else — chasing trends, ignoring risk.
Learned the hard way that survival beats prediction.
Now I share structured equity views and hedged options plays using Renko and macro context — built for consistency, not dopamine.
Learned the hard way that survival beats prediction.
Now I share structured equity views and hedged options plays using Renko and macro context — built for consistency, not dopamine.
Clause de non-responsabilité
Les informations et les publications ne sont pas destinées à être, et ne constituent pas, des conseils ou des recommandations en matière de finance, d'investissement, de trading ou d'autres types de conseils fournis ou approuvés par TradingView. Pour en savoir plus, consultez les Conditions d'utilisation.