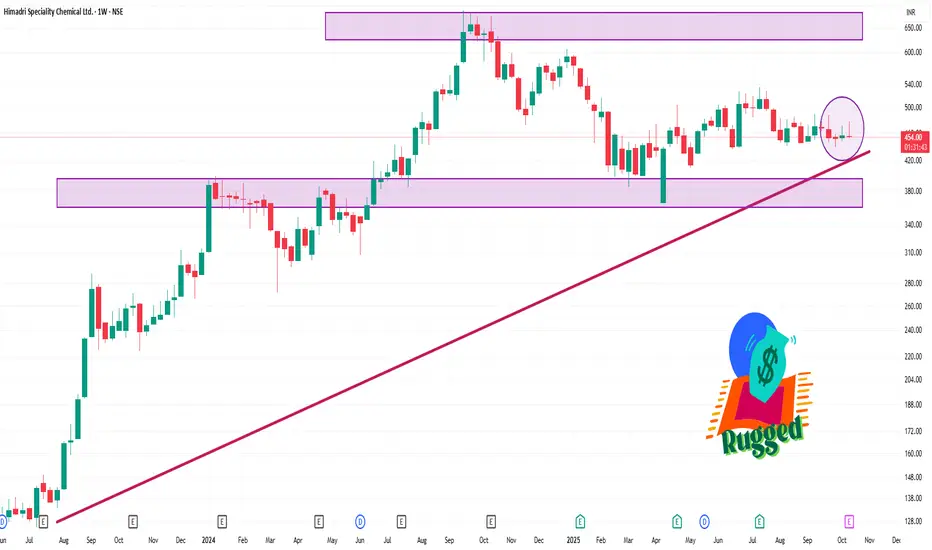
📊 1-Week Technical Overview
Price Change: HSCL has gained approximately 3.35% over the past week.
Day Range: ₹458.60 – ₹469.55
52-Week Range: ₹365.35 – ₹676.20
Volume: 535,912 shares traded
📈 Technical Indicators
Relative Strength Index (RSI): 36.75, suggesting a neutral to slightly oversold condition.
Moving Averages: Short-term (5-day) and medium-term (50-day) moving averages indicate a neutral to slightly bearish outlook.
MACD: The Moving Average Convergence Divergence indicator is negative, reinforcing a bearish sentiment.
Publications connexes
Clause de non-responsabilité
Les informations et publications ne sont pas destinées à être, et ne constituent pas, des conseils ou recommandations financiers, d'investissement, de trading ou autres fournis ou approuvés par TradingView. Pour en savoir plus, consultez les Conditions d'utilisation.