This is a chart that I sent to my members today.
It presents two potential trades on IBB:
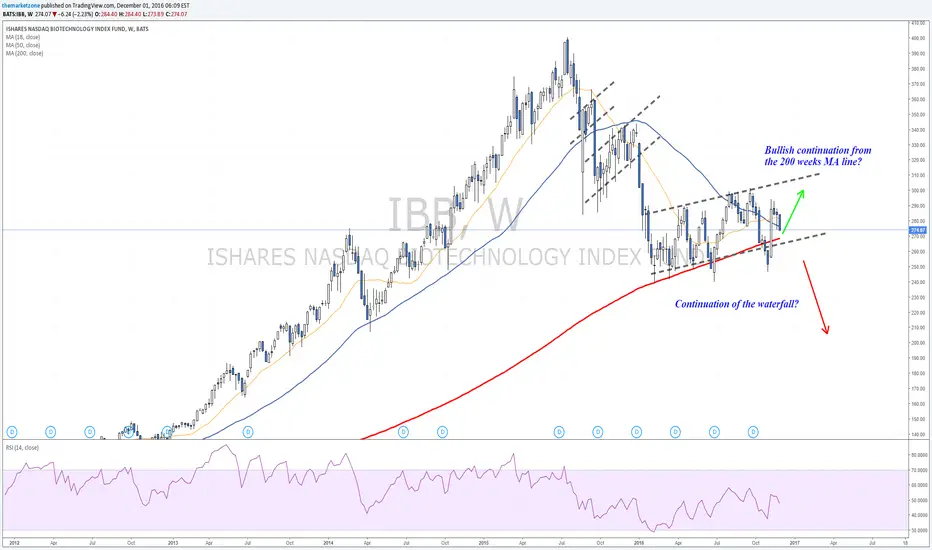
1. Bullish (short term) setup - 270$ is the key zone as it presents a weekly support zone.
2. Bearish continuation (based on longer term analysis) - Continuation of the the waterfall that started on May 2015.
Waiting to here your thoughts.
It presents two potential trades on IBB:
1. Bullish (short term) setup - 270$ is the key zone as it presents a weekly support zone.
2. Bearish continuation (based on longer term analysis) - Continuation of the the waterfall that started on May 2015.
Waiting to here your thoughts.
Note
Despite Trump's comments, IBB holds the bottom of the channel. 270$ is nearest support.
Clause de non-responsabilité
Les informations et les publications ne sont pas destinées à être, et ne constituent pas, des conseils ou des recommandations en matière de finance, d'investissement, de trading ou d'autres types de conseils fournis ou approuvés par TradingView. Pour en savoir plus, consultez les Conditions d'utilisation.