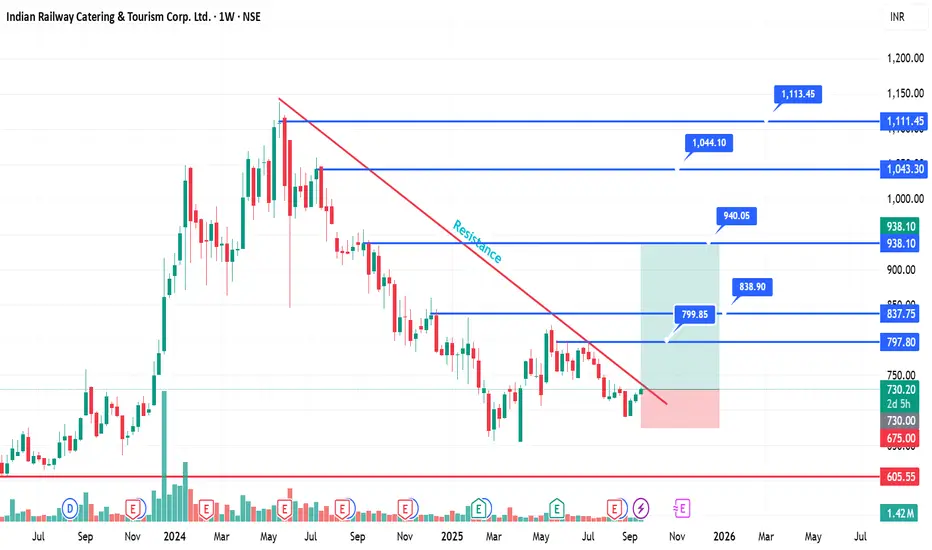
IRCTC has been in a prolonged downtrend but is now showing signs of a possible reversal after testing key support zones. The price is attempting to break the falling resistance trendline, which could trigger a bullish momentum if sustained.
🔑 Key Levels to Watch:
Support Zone: ₹675 – ₹605
Immediate Resistance Breakout Level: ₹730
Upside Targets:
₹797.80
₹837.75
₹938.10
₹1,043.30
₹1,111.45
📈 View:
If IRCTC manages to hold above ₹730 and breaks the resistance line with volume, we may see a strong rally towards ₹800+ and higher targets in the coming weeks.
📉 Risk:
A close below ₹675 may invalidate the setup and drag the stock towards ₹605 support.
⚠️ Disclaimer: This is only for educational and chart analysis purposes, not financial advice. Do your own research before investing/trading.
#IRCTC #StockMarketIndia #NSE #SwingTrading #Breakout #TradingSetup #StockAnalysis #ChartPattern #Resistance #Support #IndianStocks #WeeklyChart
Clause de non-responsabilité
Les informations et publications ne sont pas destinées à être, et ne constituent pas, des conseils ou recommandations financiers, d'investissement, de trading ou autres fournis ou approuvés par TradingView. Pour en savoir plus, consultez les Conditions d'utilisation.
Clause de non-responsabilité
Les informations et publications ne sont pas destinées à être, et ne constituent pas, des conseils ou recommandations financiers, d'investissement, de trading ou autres fournis ou approuvés par TradingView. Pour en savoir plus, consultez les Conditions d'utilisation.