As of May 1, 2025, at 10:20 AM IST, ITC Ltd (NSE: ITC) is trading at ₹403.05. Based on recent technical analysis, here are the key support and resistance levels for the stock on a weekly (1W) chart:
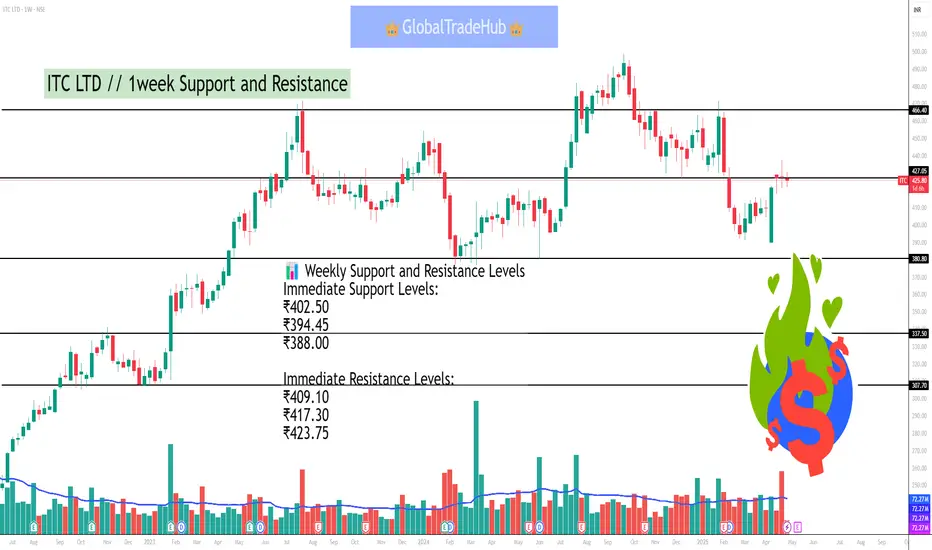
📊 Weekly Support and Resistance Levels
Immediate Support Levels:
₹402.50
₹394.45
₹388.00
Immediate Resistance Levels:
₹409.10
₹417.30
₹423.75
These levels suggest that if the stock price declines below ₹402.50, it may find support around ₹394.45 and ₹388.00. Conversely, if the price rises above ₹409.10, it could encounter resistance near ₹417.30 and ₹423.75.
🔍 Technical Indicators
ADX (Average Directional Index): 29.19 – indicates a trending market.
RSI (Relative Strength Index): 47.4 – suggests neutral momentum.
MACD (Moving Average Convergence Divergence): -4.66 – indicates a negative trend.
CCI (Commodity Channel Index): 2.74 – suggests neutral momentum.
These indicators suggest a neutral to slightly bearish outlook for ITC in the short term.
📈 Summary
ITC is currently trading near its immediate support levels. A break below ₹402.50 could lead to a decline towards ₹394.45 and ₹388.00. On the upside, resistance is observed at ₹409.10, ₹417.30, and ₹423.75. Traders should monitor these levels closely, as a decisive move beyond these support or resistance levels could signal the next directional move.
Publications connexes
Clause de non-responsabilité
Les informations et les publications ne sont pas destinées à être, et ne constituent pas, des conseils ou des recommandations en matière de finance, d'investissement, de trading ou d'autres types de conseils fournis ou approuvés par TradingView. Pour en savoir plus, consultez les Conditions d'utilisation.