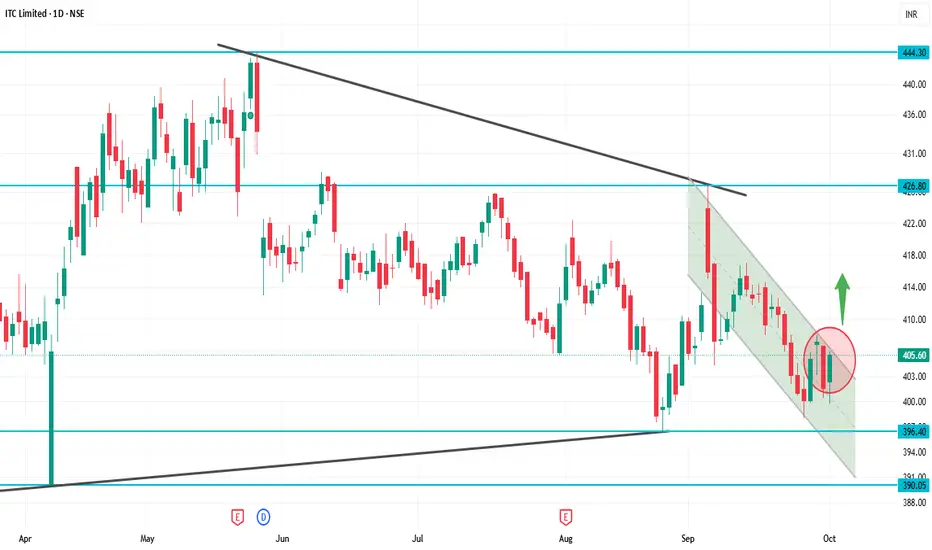
Current Price: ₹405.60
52-Week High: ₹524.35
52-Week Low: ₹390.15
Trend: Downward — trading below 5, 20, 50, 100, 200-day moving averages
Daily Chart Insights
Price below moving averages → bearish trend.
RSI & MACD → weak momentum, signaling short-term selling pressure.
Support zone at ₹390–₹400 → critical; a break below can push price down to ₹370–₹380.
Resistance at ₹420–₹430 → a strong close above may signal trend reversal.
Strategy / Outlook
Bearish Bias: Short-term trend is downward.
Buying Opportunity: Near support zones (₹390–₹400) if it holds.
Bullish Trigger: Close above ₹430 with strong volume indicates potential reversal.
Risk Management: Use stop-loss below critical support zones.
Publications connexes
Clause de non-responsabilité
Les informations et publications ne sont pas destinées à être, et ne constituent pas, des conseils ou recommandations financiers, d'investissement, de trading ou autres fournis ou approuvés par TradingView. Pour en savoir plus, consultez les Conditions d'utilisation.