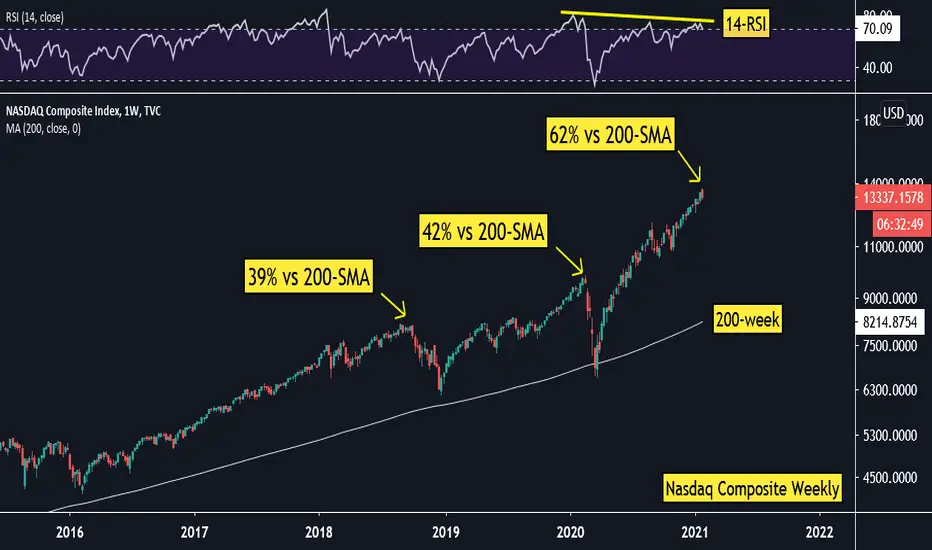
Technology sector earnings remain fairly strong and there’s ample liquidity being provided by the US Federal Reserve, however it may be worth noting that the index trades 62% above it’s 200-week SMA. Prior extensions: +42% (Feb 2020) & 39% (Oct 2018). Should the index close at current levels or lower, the candle structure would be a ‘dark cloud cover’ as per the weekly chart. In addition, the weekly chart RSI has developed lower highs (negative divergence). While it may drift a few points higher, the risk to reward does not appear attractive from a buy/long perspective. Caution to those who are overly optimistic on US Technology shares. Last Close: 13337
Clause de non-responsabilité
Les informations et publications ne sont pas destinées à être, et ne constituent pas, des conseils ou recommandations financiers, d'investissement, de trading ou autres fournis ou approuvés par TradingView. Pour en savoir plus, consultez les Conditions d'utilisation.
Clause de non-responsabilité
Les informations et publications ne sont pas destinées à être, et ne constituent pas, des conseils ou recommandations financiers, d'investissement, de trading ou autres fournis ou approuvés par TradingView. Pour en savoir plus, consultez les Conditions d'utilisation.