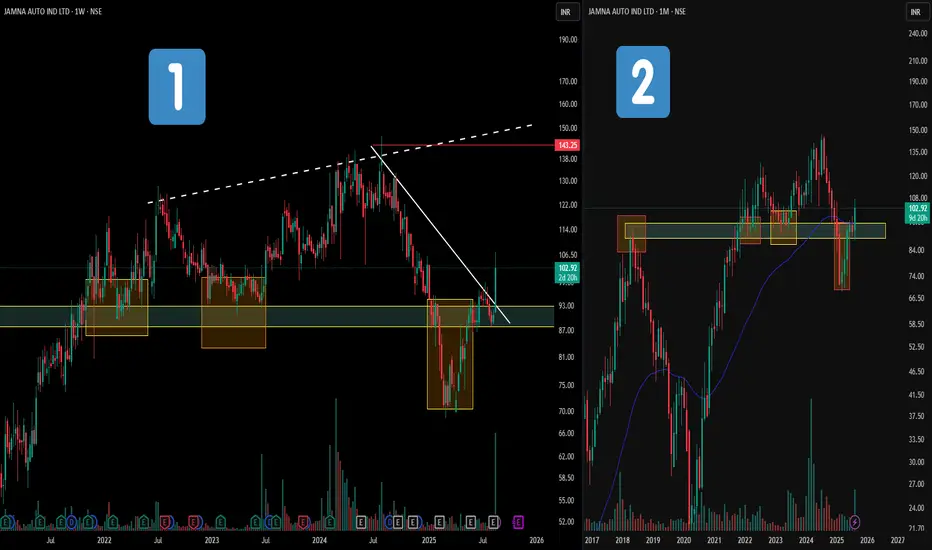
🔹 Left Side (Weekly Timeframe - WTF)
-The white downward line marks the counter-trendline (CT) break, showing the first sign of momentum shift.
-The dashed white upper line connects the higher highs, forming part of a broadening structure.
-Strong volumes when price moves up and drop in volumes when price goes sideways shows that there is no volume price divergence
🔹 Right Side (Monthly Timeframe - MTF)
-The orange boxes highlight historical supply-demand confluence points where the stock has repeatedly reacted.
-The larger yellow zone represents the major demand zone, which price has respected and consolidated above.
-Price action shows a clear conversion from supply → demand.
🎯 Master My Self-Made Trading Strategy
📈 Telegram (Learn Today): t.me/hashtaghammer
✅ WhatsApp (Learn Today): wa.me/919455664601
📈 Telegram (Learn Today): t.me/hashtaghammer
✅ WhatsApp (Learn Today): wa.me/919455664601
Publications connexes
Clause de non-responsabilité
Les informations et publications ne sont pas destinées à être, et ne constituent pas, des conseils ou recommandations financiers, d'investissement, de trading ou autres fournis ou approuvés par TradingView. Pour en savoir plus, consultez les Conditions d'utilisation.