$JD ascending triangle #bullish #breakout on weekly #chart
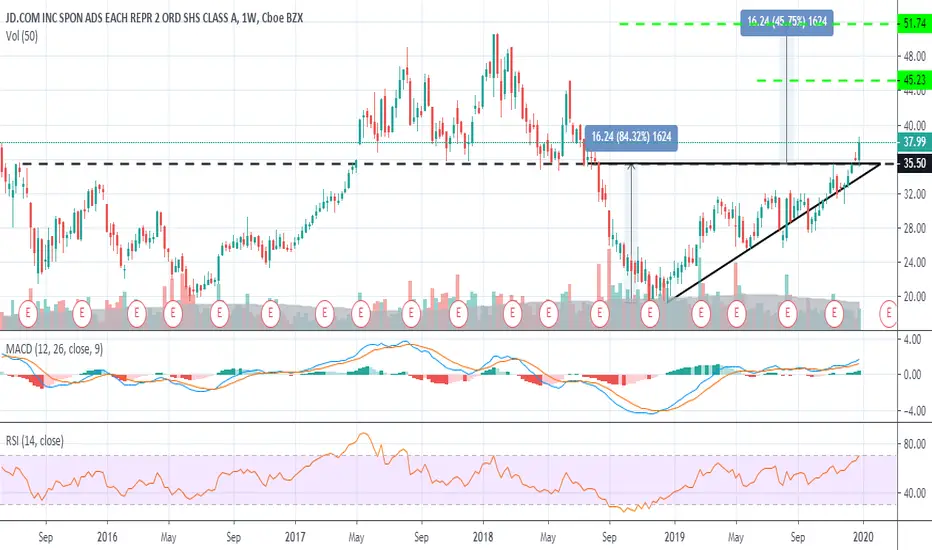
After last support break the stock price drifted lower until it bottomed around 19.20 levels after the DEC'18 selloff
Since then the price has formed a nice ascending triangle from which has broken out in late DEC'19 after the announcement of Phase1 Deal between US and China
Volume is not yet what I would like it to be, but MACD and RSI have both sustained the move up
Targets are:
T1 - former JUN'18 high before the last leg down at 45.23
T2 - measured move from the triangle breakout at 51.74
Good luck,
TA
Trade fermée: cible de profit atteinte
Both targets have been reachedCongrats longs,
TA
Clause de non-responsabilité
Les informations et publications ne sont pas destinées à être, et ne constituent pas, des conseils ou recommandations financiers, d'investissement, de trading ou autres fournis ou approuvés par TradingView. Pour en savoir plus, consultez les Conditions d'utilisation.
Clause de non-responsabilité
Les informations et publications ne sont pas destinées à être, et ne constituent pas, des conseils ou recommandations financiers, d'investissement, de trading ou autres fournis ou approuvés par TradingView. Pour en savoir plus, consultez les Conditions d'utilisation.