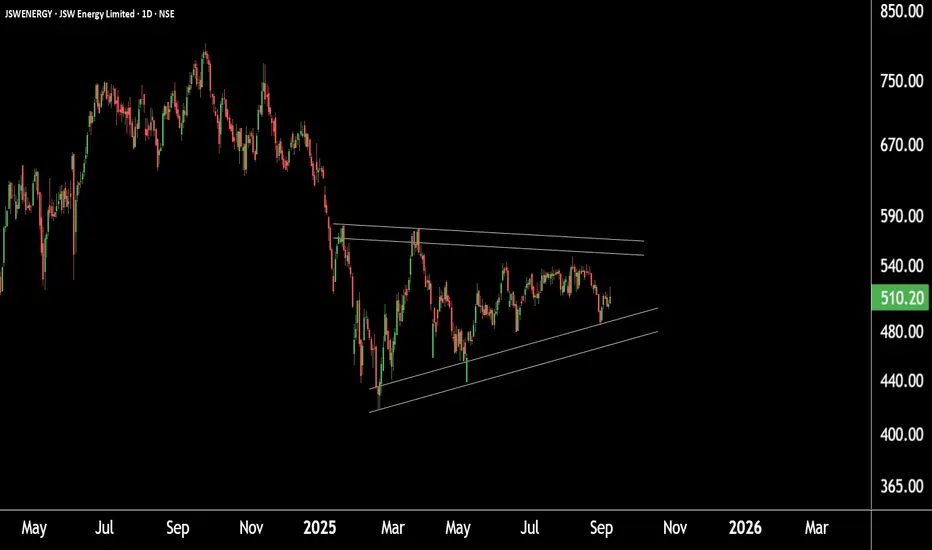
This is the daily timeframe chart of JSW Energy.
The stock is currently forming a symmetrical triangle pattern with support around ₹465–₹475 and resistance near ₹564–₹570.
If JSW Energy sustains above this resistance zone, it could trigger a breakout, potentially leading to higher price levels in the coming sessions.
Thank you.
The stock is currently forming a symmetrical triangle pattern with support around ₹465–₹475 and resistance near ₹564–₹570.
If JSW Energy sustains above this resistance zone, it could trigger a breakout, potentially leading to higher price levels in the coming sessions.
Thank you.
@RahulSaraoge
Connect us at t.me/stridesadvisory
Connect us at t.me/stridesadvisory
Clause de non-responsabilité
Les informations et les publications ne sont pas destinées à être, et ne constituent pas, des conseils ou des recommandations en matière de finance, d'investissement, de trading ou d'autres types de conseils fournis ou approuvés par TradingView. Pour en savoir plus, consultez les Conditions d'utilisation.