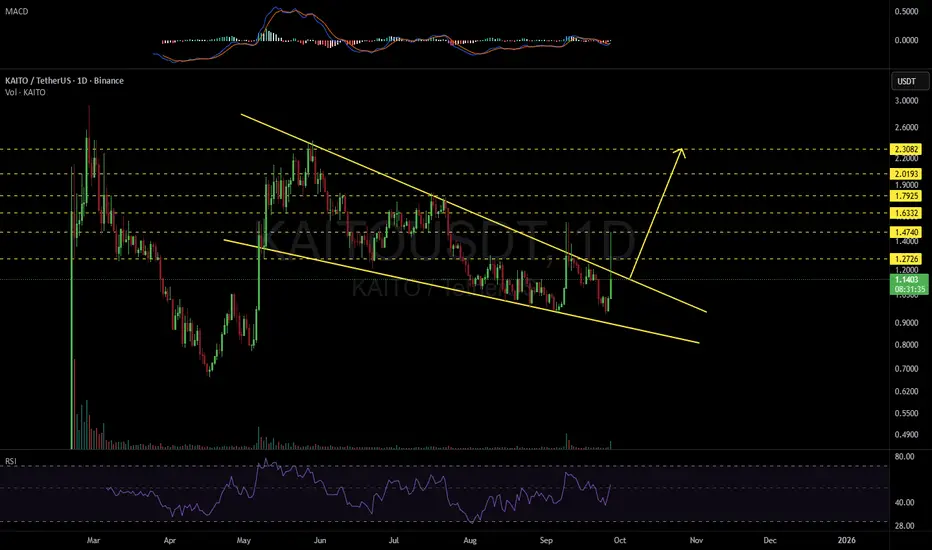
#KAITO is moving inside a falling wedge pattern on the daily chart. Volume has increased and RSI and MACD are turning bullish. #KAITO is on the verge of breaking out. If that happens, the potential targets are:
🎯 $1.2726
🎯 $1.4740
🎯 $1.6332
🎯 $1.7925
🎯 $2.0193
🎯 $2.3082
⚠️ Always remember to use a tight stop-loss and follow proper risk management.
🎯 $1.2726
🎯 $1.4740
🎯 $1.6332
🎯 $1.7925
🎯 $2.0193
🎯 $2.3082
⚠️ Always remember to use a tight stop-loss and follow proper risk management.
Clause de non-responsabilité
Les informations et les publications ne sont pas destinées à être, et ne constituent pas, des conseils ou des recommandations en matière de finance, d'investissement, de trading ou d'autres types de conseils fournis ou approuvés par TradingView. Pour en savoir plus, consultez les Conditions d'utilisation.