Price action and chart pattern trading
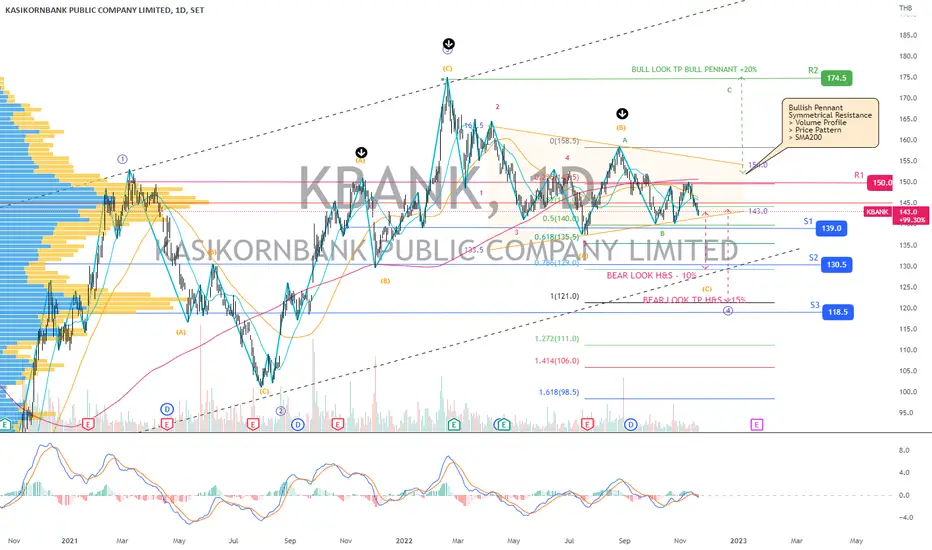
> A 2 conflicting pattern with a bearish move from the larger Head & Shoulders pattern and a bullish one with current bull pennant.
> The larger HS pattern could be overshadowing the smaller pennant pushing the price lower - SMA20 dead crossed SMA50.
> A strong symmetrical resistance; upper volume profile, price resistance, and SMA200.
> This 4-wave diagonal projection is based on the unsuccessful breakout scenario with an upcoming C leg downtrend extension 0.786 - 1.0 approximately - 10 - 15% downside.
> A bullish scenario is based on the successful breakout of bull pennant and SMA200 targeting the previous 3-wave high with a +20% upside.
> Indicator: bearish MACD signal crossing below the signal and baseline
Always trade with affordable risk and respect your stoploss!
Clause de non-responsabilité
Les informations et publications ne sont pas destinées à être, et ne constituent pas, des conseils ou recommandations financiers, d'investissement, de trading ou autres fournis ou approuvés par TradingView. Pour en savoir plus, consultez les Conditions d'utilisation.
Clause de non-responsabilité
Les informations et publications ne sont pas destinées à être, et ne constituent pas, des conseils ou recommandations financiers, d'investissement, de trading ou autres fournis ou approuvés par TradingView. Pour en savoir plus, consultez les Conditions d'utilisation.