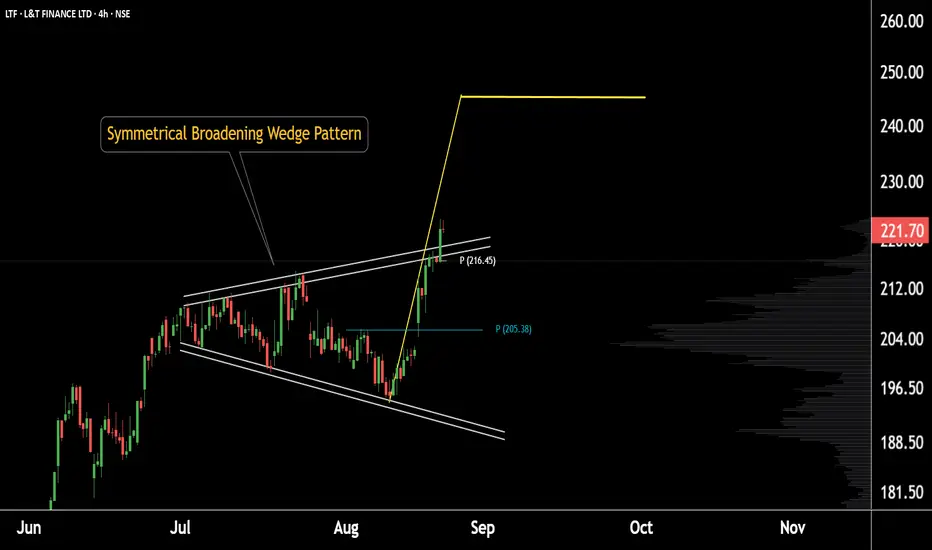
This is the daily chart of L&T Finance.
The stock has been forming a broadening wedge pattern and has recently given a pattern breakout around 220.
Currently, L&T Finance is sustaining above its daily pivot level of 216, with strong support in the 215–220 zone.
If this support holds, we may witness higher prices in the stock.
Thank you.
The stock has been forming a broadening wedge pattern and has recently given a pattern breakout around 220.
Currently, L&T Finance is sustaining above its daily pivot level of 216, with strong support in the 215–220 zone.
If this support holds, we may witness higher prices in the stock.
Thank you.
@RahulSaraoge
Connect us at t.me/stridesadvisory
Connect us at t.me/stridesadvisory
Clause de non-responsabilité
Les informations et les publications ne sont pas destinées à être, et ne constituent pas, des conseils ou des recommandations en matière de finance, d'investissement, de trading ou d'autres types de conseils fournis ou approuvés par TradingView. Pour en savoir plus, consultez les Conditions d'utilisation.