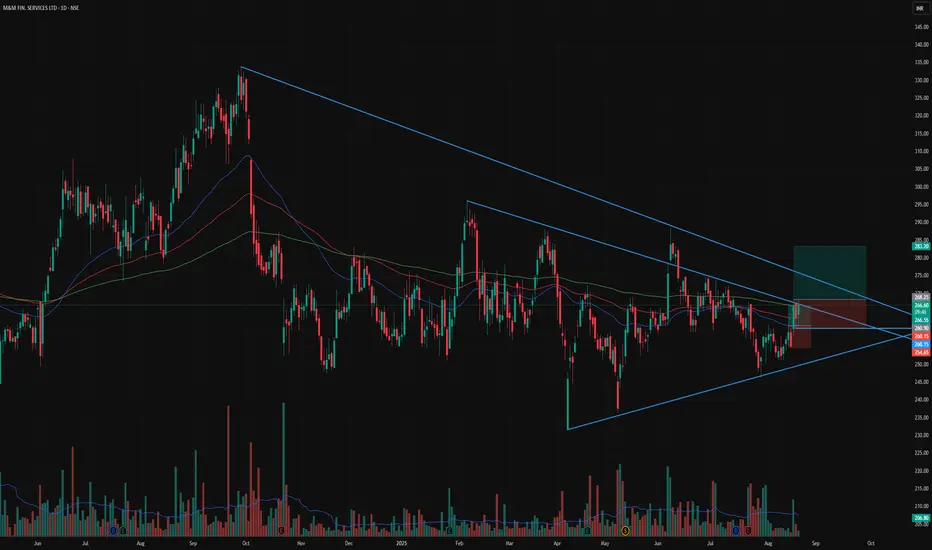
📊 Stock: M&M Financial Services (M&MFIN)
🔹 Symmetrical triangle pattern forming – price squeezing into apex
🔹 Strong bounce from lower trendline with rising volume
🔹 Trading above 50 DMA & 100 DMA – short-term trend improving
🔹 200 DMA resistance near ₹268–270 being tested
🔹 RSI showing strength
🔹 Good support zone at ₹250–255
🔹 Strong financial backing as part of M&M Group
⚡ Price nearing breakout zone (₹268–270)
🚀 Breakout above 268 can trigger a rally towards ₹283–300
⚠️ Support at ₹250 – below this trend may weaken
Clause de non-responsabilité
Les informations et publications ne sont pas destinées à être, et ne constituent pas, des conseils ou recommandations financiers, d'investissement, de trading ou autres fournis ou approuvés par TradingView. Pour en savoir plus, consultez les Conditions d'utilisation.
Clause de non-responsabilité
Les informations et publications ne sont pas destinées à être, et ne constituent pas, des conseils ou recommandations financiers, d'investissement, de trading ou autres fournis ou approuvés par TradingView. Pour en savoir plus, consultez les Conditions d'utilisation.