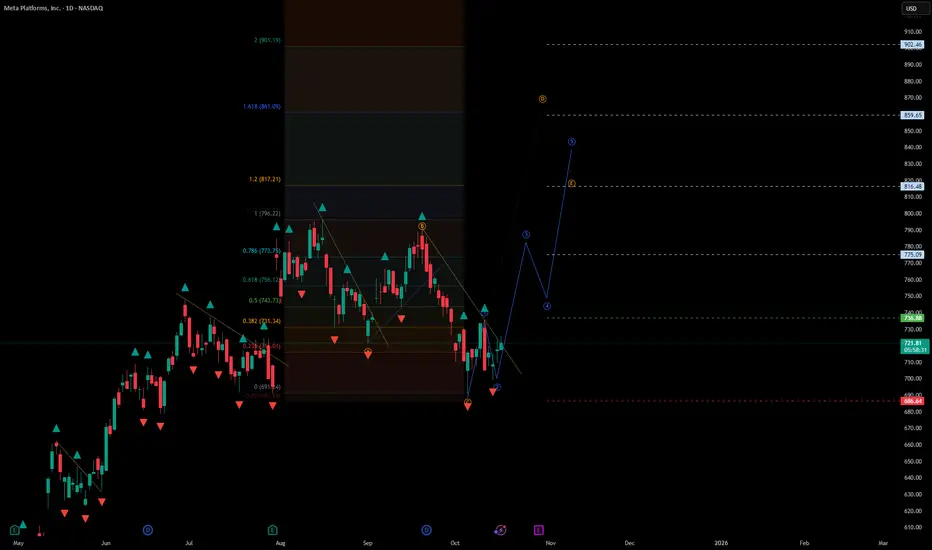
#Meta – Recovery Structure and Bullish Continuation Setup
Current price: $723.2
Meta is building a bullish recovery structure after completing a corrective decline. The market is stabilizing near key support and may be preparing for a renewed upward leg within the larger trend.
🧩 Technical Overview
• The downtrend from the August high has likely formed a complete corrective pattern.
• Price rebounded from the $686–$690 support zone and is attempting to re-enter the mid-term ascending channel.
• Momentum has shifted from exhaustion to accumulation — typical for a trend-continuation setup.
📈 Scenario
• As long as the price holds above $686, the structure favors an upward move.
• Stop-loss: below $686, under the recent corrective low.
• Upside levels to watch:
– $736–$755 — early confirmation zone / local breakout test
– $775–$816 — key resistance area, mid-cycle confirmation
– $860–$902 — extended target range based on Fibonacci projections
• A daily close above $755 would confirm strength and continuation toward the higher targets.
⚙️ Market Context
• The broader NASDAQ structure supports recovery across large-cap tech stocks.
• Meta remains in a long-term bullish framework despite the recent correction.
• Volume behavior and market breadth show early signs of capital rotation back into growth assets.
🧭 Summary
Meta is forming a recovery leg after a controlled correction.
Holding above $686 keeps the bullish bias active, with first confirmation above $736 and major continuation signals over $755.
Targets for the next impulse are projected near $816, $860, and potentially $900+.
Clause de non-responsabilité
Les informations et les publications ne sont pas destinées à être, et ne constituent pas, des conseils ou des recommandations en matière de finance, d'investissement, de trading ou d'autres types de conseils fournis ou approuvés par TradingView. Pour en savoir plus, consultez les Conditions d'utilisation.