📌 Current Price Snapshot
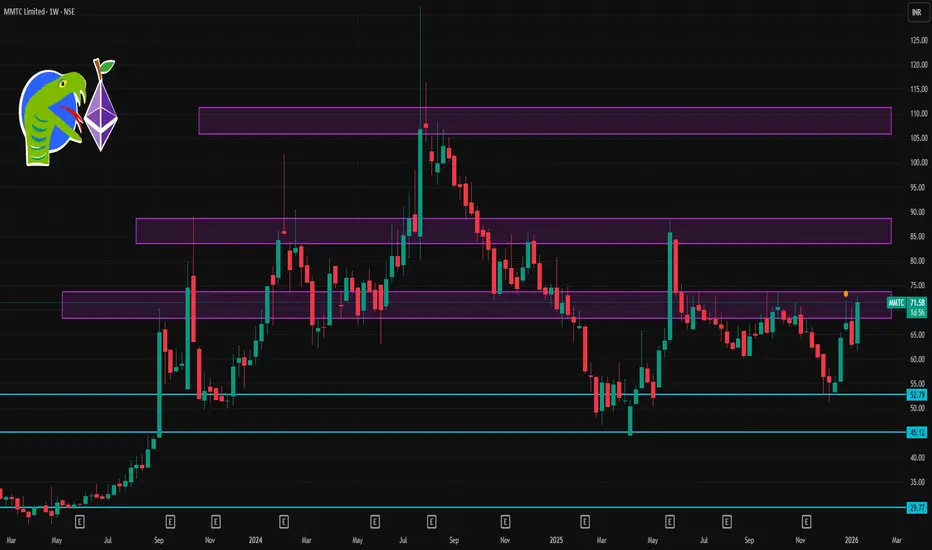
Latest traded price: ~₹71.5 – ₹72.7 on NSE today with strong intraday volatility. Daily high ~₹72.70 and low ~₹63.86.
This wide daily range suggests higher volatility this week — at least through the next few sessions.
📊 Short‑Term Weekly Levels
🔹 Resistance (Upside)
These are levels where price may face selling pressure or slow gains:
1. ₹72.5 – ₹73.0 — Immediate resistance area (today’s local high).
2. ₹75.0 – ₹76.0 — Next bullish pivot region if the stock holds above ₹72.5 (based on momentum models).
3. ₹78.0 – ₹80.0 — Stronger weekly upward pull target if bullish continuation holds.
👉 Closing above ₹75 on the weekly timeframe would indicate stronger short‑term bullish structure.
🔻 Support (Downside)
Levels where buyers may step in on pullbacks:
1. ₹66.0 – ₹67.0 — First dynamic support (near shorter moving averages).
2. ₹62.0 – ₹63.5 — Key lower support zone (recent daily lows).
3. ₹60.0 – ₹61.0 — Deeper weekly support — important to watch if breakdown accelerates.
👉 A break below ₹62 on weekly closes would weaken the bullish outlook and could open the door toward deeper supports.
📈 Technical Indicator Context
Technical breadth is largely bullish/momentum supportive:
📌 Moving Averages:
5, 10, 20, 50, 100, and 200‑day MAs all skew Buy — suggesting bullish trend alignment.
📌 RSI (14): ~65 — trending up but not yet extremely overbought.
📌 Stoch/RSI: Overbought on shorter timeframes — may hint at near‑term consolidation before higher breakout.
Summary: Momentum still skewed bullish overall, but short‑term traders should watch for near‑term pullbacks or consolidations due to overbought signals.
Publications connexes
Clause de non-responsabilité
Les informations et publications ne sont pas destinées à être, et ne constituent pas, des conseils ou recommandations financiers, d'investissement, de trading ou autres fournis ou approuvés par TradingView. Pour en savoir plus, consultez les Conditions d'utilisation.