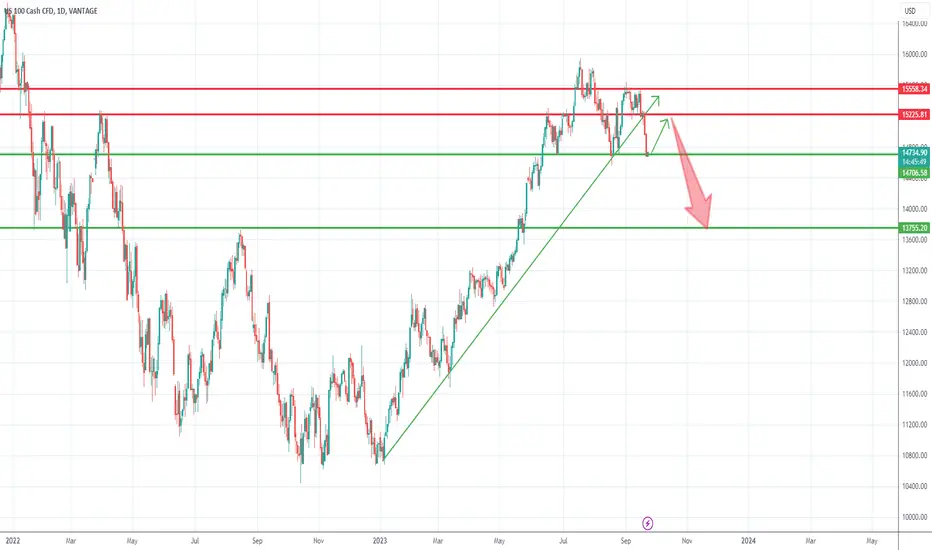
On 13 September I wrote that Nas100 could lose trend line support and, as long as the 15500 zone is intact as resistance, there is a high chance for the index to drop to 14700-14800 zone support.
As we can see from the chart, after a new test of the resistance zone on 15 September, the index started to drop again and, two days ago we had a strong break under the trend line and a dive directly to horizontal support.
At this moment, a correction is probable, but, in my opinion, this rise will be short-lived and should be used as an opportunity for short trades.
In conclusion, rallies above 15k should be sold and the medium-term target for such a trade could be in the 14k zone and slightly under.
📈 Forex & XAU/USD Channel:
t.me/intradaytradingsignals
💎 Crypto Channel:
t.me/FanCryptocurrency
Publications connexes
Clause de non-responsabilité
Les informations et publications ne sont pas destinées à être, et ne constituent pas, des conseils ou recommandations financiers, d'investissement, de trading ou autres fournis ou approuvés par TradingView. Pour en savoir plus, consultez les Conditions d'utilisation.