Natural Gas (NG) Weekly Breakout Brewing — 80% Upside Potential!
Current Price: $3.090
Technical View (Weekly Timeframe):
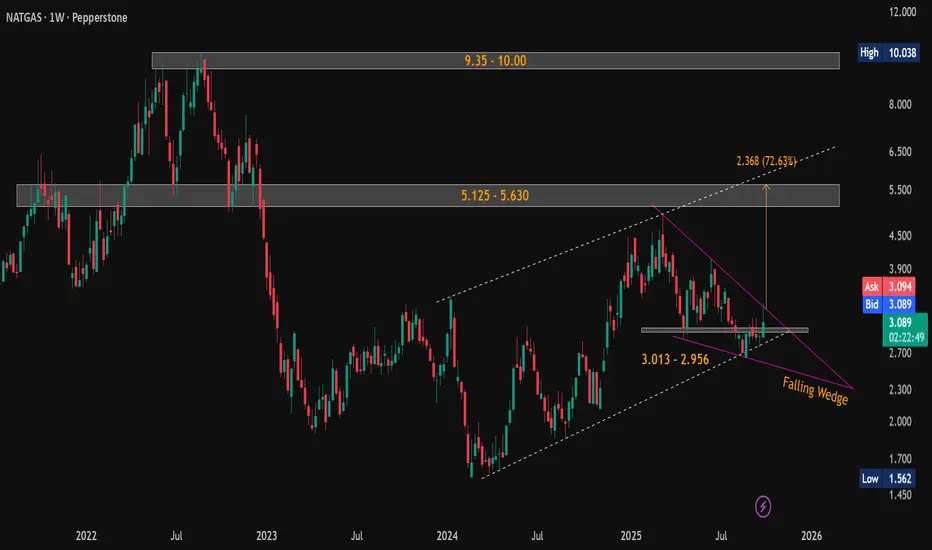
Natural Gas has formed a classic falling wedge pattern on the weekly chart - a strong bullish reversal setup. Price action is currently on the verge of breakout, with increasing volume and narrowing range suggesting imminent movement.
🟢 Strong Support Zones:
$3.013 – $2.956
$2.692 – $2.643
🔺 Key Resistance / Upside Targets:
Short-term: $5.125 – $5.630 (Pattern target: $5.625)
Long-term: $9.35 – $10.00
📈 The pattern breakout target of $5.625 aligns closely with the major resistance zone of $5.125 – $5.630, representing a potential ~80% upside from current levels.
Look for confirmed breakout above the wedge resistance with strong volume for trend continuation.
#NaturalGas | #NG | #FallingWedge | #ChartPatterns | #TechnicalAnalysis | #PriceAction
📌 Disclaimer: This analysis is shared for educational purposes only. It is not a buy/sell recommendation. Please do your own research before making any trading decisions.
Technical View (Weekly Timeframe):
Natural Gas has formed a classic falling wedge pattern on the weekly chart - a strong bullish reversal setup. Price action is currently on the verge of breakout, with increasing volume and narrowing range suggesting imminent movement.
🟢 Strong Support Zones:
$3.013 – $2.956
$2.692 – $2.643
🔺 Key Resistance / Upside Targets:
Short-term: $5.125 – $5.630 (Pattern target: $5.625)
Long-term: $9.35 – $10.00
📈 The pattern breakout target of $5.625 aligns closely with the major resistance zone of $5.125 – $5.630, representing a potential ~80% upside from current levels.
Look for confirmed breakout above the wedge resistance with strong volume for trend continuation.
#NaturalGas | #NG | #FallingWedge | #ChartPatterns | #TechnicalAnalysis | #PriceAction
📌 Disclaimer: This analysis is shared for educational purposes only. It is not a buy/sell recommendation. Please do your own research before making any trading decisions.
Clause de non-responsabilité
Les informations et les publications ne sont pas destinées à être, et ne constituent pas, des conseils ou des recommandations en matière de finance, d'investissement, de trading ou d'autres types de conseils fournis ou approuvés par TradingView. Pour en savoir plus, consultez les Conditions d'utilisation.