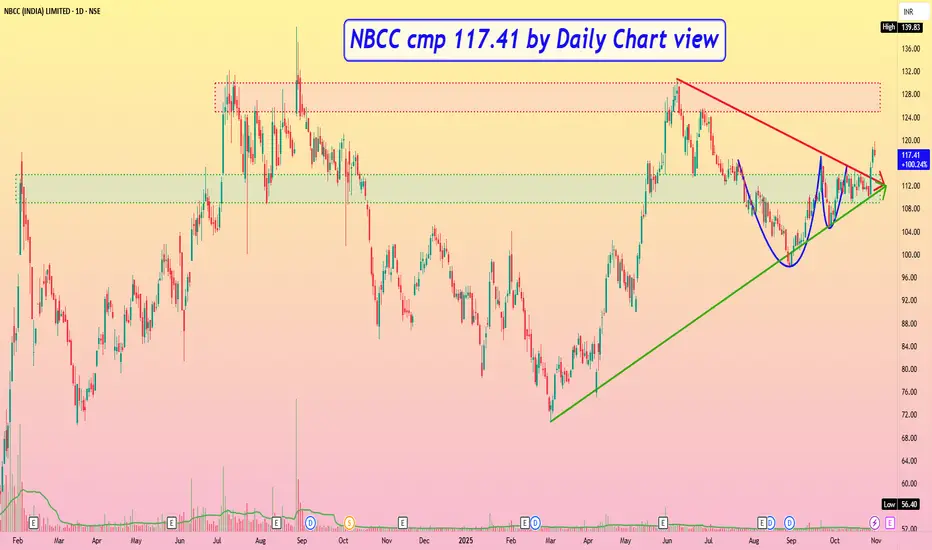
NBCC cmp 117.41 by Daily Chart view
* Support Zone 109 to 114 Price Band
* Resistance Zone 125 to 130 Price Band then 137 to ATH 139.83
* Bullish Cup and Handle pattern is made around the Support Zone
* Symmetrical Triangle pattern breakout seems to be in making process
* Volumes in good sync with avg traded quantity and spiking above it too
* Falling Resistance Trendline Breakout with Rising Support Trendline well respected
Clause de non-responsabilité
Les informations et les publications ne sont pas destinées à être, et ne constituent pas, des conseils ou des recommandations en matière de finance, d'investissement, de trading ou d'autres types de conseils fournis ou approuvés par TradingView. Pour en savoir plus, consultez les Conditions d'utilisation.