📊 Key daily levels to watch
Here are approximate levels based on recent data:
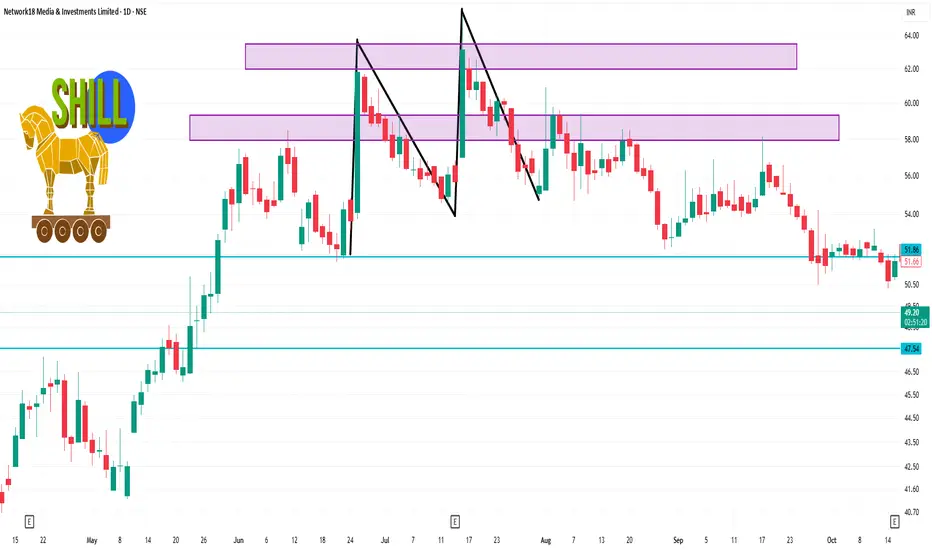
Support: around ₹47.50-₹48.00 region (the near lower band)
Resistance: around ₹50.00-₹52.00 region — a near barrier if the stock tries to bounce.
Pivot/central reference: ~ ₹48.15 (classic pivot) for the day.
📌 Interpretation for a Day Trader
a) If price remains above ~₹48.00 and holds, that level may act as a short-term base.
b) A decisive break above ~₹49.50-₹50.10 with good volume could open a short relief move towards the next resistance zone.
Conversely, a break below ~₹47.50 would signal risk of deeper downside and may invalidate the c) short-term support.
d) Because the trend/indicator setup is weak (daily technicals show “Strong Sell” for daily timeframe), any long trade should be cautious and risk-managed.
Here are approximate levels based on recent data:
Support: around ₹47.50-₹48.00 region (the near lower band)
Resistance: around ₹50.00-₹52.00 region — a near barrier if the stock tries to bounce.
Pivot/central reference: ~ ₹48.15 (classic pivot) for the day.
📌 Interpretation for a Day Trader
a) If price remains above ~₹48.00 and holds, that level may act as a short-term base.
b) A decisive break above ~₹49.50-₹50.10 with good volume could open a short relief move towards the next resistance zone.
Conversely, a break below ~₹47.50 would signal risk of deeper downside and may invalidate the c) short-term support.
d) Because the trend/indicator setup is weak (daily technicals show “Strong Sell” for daily timeframe), any long trade should be cautious and risk-managed.
Publications connexes
Clause de non-responsabilité
Les informations et publications ne sont pas destinées à être, et ne constituent pas, des conseils ou recommandations financiers, d'investissement, de trading ou autres fournis ou approuvés par TradingView. Pour en savoir plus, consultez les Conditions d'utilisation.