Analysis Date: September 8, 2025
Current Price: $3.125
Market Session: Post-Market Analysis
---
Executive Summary
---
Quarterly Volume Profile Analysis
Institutional Positioning Intelligence
The quarterly volume profile (Q3 2025) displays the most compelling institutional accumulation pattern across all analyzed markets:
Primary Institutional Accumulation Zone: $2.90-$3.15
Volume Profile Architecture:
Resistance Structure Analysis:
Price Structure Context
Historical Pattern Recognition:
The current Natural Gas setup mirrors successful commodity reversal patterns, particularly the proven crude oil institutional accumulation model. The exceptional width and intensity of institutional volume at current levels suggests this represents a major strategic allocation by smart money participants.
Critical Structure Validation:
Seasonal and Fundamental Context
Seasonal Dynamics Supporting Institutional Positioning:
---

Execution Chart Technical Analysis
Current Technical Configuration - BULLISH ALIGNMENT
DEMA Analysis - CONFIRMED BULLISH SIGNAL:
DMI/ADX Assessment - STRONG TRENDING CONDITIONS:
Stochastic Analysis - MOMENTUM CONFIRMATION:
Support and Resistance Levels
Immediate Technical Levels:
---
Trading Scenarios and Setup Criteria
Scenario 1: Continuation Long Setup (PRIMARY)
Optimal Conditions for Long Entry:
Entry Protocol:
Profit Targets:
Scenario 2: Pullback Accumulation Setup (SECONDARY)
Conditions for Pullback Entry:
Pullback Setup Parameters:
Scenario 3: Breakout Acceleration Setup (AGGRESSIVE)
Breakout Trading Framework:
Breakout Parameters:
---
Risk Management Protocols
Position Sizing Guidelines
Aggressive Approach (Recommended for NG):
Stop Loss Hierarchy
Profit Management Framework
Systematic Profit Taking:
---
Market Context and External Factors
Fundamental Catalysts Supporting Bullish Thesis
Supply/Demand Dynamics:
Seasonal Factors:
Technical Market Structure
Commitment of Traders Alignment:
---
Monitoring Checklist and Alert Levels
Daily Monitoring Requirements
Critical Alert Levels
Bullish Escalation Alerts:
Risk Management Alerts:
---
Strategic Outlook and Conviction Assessment
Risk/Reward Analysis
Exceptional Setup Characteristics:
Portfolio Allocation Recommendation
Allocation Framework:
---
Conclusion and Strategic Assessment
Implementation Priority: Immediate action recommended - this setup quality rarely presents itself with such clear institutional validation and technical confirmation.
Next Review: Daily monitoring of DEMA configuration and institutional level respect
Position Management: Systematic profit-taking protocol with trailing stops at institutional levels
---
Important Disclaimer
Current Price: $3.125
Market Session: Post-Market Analysis
---
Executive Summary
Natural Gas presents the highest conviction opportunity in the current market environment, with exceptional alignment between institutional positioning and technical momentum. The quarterly volume profile reveals massive institutional accumulation at current levels, while execution chart signals confirm a validated reversal pattern. This represents a classic institutional intelligence-based setup with superior risk/reward characteristics.
---
Quarterly Volume Profile Analysis
Institutional Positioning Intelligence
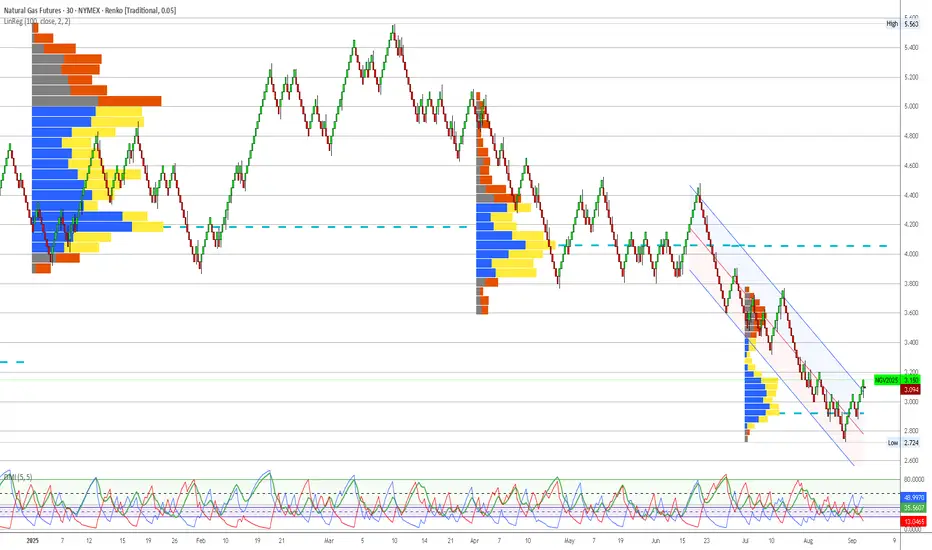
The quarterly volume profile (Q3 2025) displays the most compelling institutional accumulation pattern across all analyzed markets:
Primary Institutional Accumulation Zone: $2.90-$3.15
- Extraordinary blue volume concentration representing massive institutional positioning
- Current price ($3.125) sits in the optimal zone within this accumulation area
- Volume density indicates sustained institutional commitment over extended period
- Width and intensity of blue volume suggests major strategic positioning campaign
Volume Profile Architecture:
- Core Accumulation: $3.00-$3.10 (heaviest institutional activity)
- Extended Support: $2.90-$3.00 (secondary institutional positioning)
- Breakout Level: $3.15-$3.20 (upper boundary of accumulation zone)
- Void Zone: Below $2.85 (minimal institutional interest, evacuation territory)
Resistance Structure Analysis:
- $3.25-$3.40: First institutional resistance with mixed volume
- $3.60-$3.80: Moderate yellow volume indicating previous distribution
- $4.00+: Historical distribution zones from earlier 2025 highs
Price Structure Context
Historical Pattern Recognition:
The current Natural Gas setup mirrors successful commodity reversal patterns, particularly the proven crude oil institutional accumulation model. The exceptional width and intensity of institutional volume at current levels suggests this represents a major strategic allocation by smart money participants.
Critical Structure Validation:
- Institutional Floor: $2.90 represents absolute lower boundary of smart money positioning
- Volume Point of Control: $3.05 shows peak institutional activity within accumulation zone
- Conviction Level: Volume density indicates highest institutional commitment in analyzed market set
- Risk Definition: Clear institutional boundaries provide precise risk management parameters
Seasonal and Fundamental Context
Seasonal Dynamics Supporting Institutional Positioning:
- September-October: Transition into heating season demand
- Storage injection season ending: Supply/demand dynamics shifting
- Winter weather preparation: Industrial and residential demand increases
- Power generation demand: Continued baseload electricity requirements
---
Execution Chart Technical Analysis
Current Technical Configuration - BULLISH ALIGNMENT
DEMA Analysis - CONFIRMED BULLISH SIGNAL:
- Black Line (Fast DEMA 12): Currently at $3.14
- Orange Line (Slow DEMA 20): Currently at $3.10
- Configuration: Strong bullish crossover confirmed and expanding
- Trend Bias: Technical momentum strongly bullish, aligned with institutional positioning
DMI/ADX Assessment - STRONG TRENDING CONDITIONS:
- ADX Level: 44+ indicating powerful directional movement
- +DI vs -DI: +DI clearly dominant over -DI
- Momentum Direction: Confirming sustained bullish bias
- Trend Strength: Exceptional ADX reading suggests institutional conviction
Stochastic Analysis - MOMENTUM CONFIRMATION:
- Tactical Stochastic (5,3,3): Bullish configuration with room for extension
- Strategic Stochastic (50,3,3): Confirming longer-term bullish momentum
- Divergence Analysis: No negative divergences, clean momentum structure
Support and Resistance Levels
Immediate Technical Levels:
- Current Support: $3.075 (DEMA 20 orange line)
- Key Support: $3.00 (institutional accumulation core)
- Major Support: $2.95 (institutional floor approach)
- Immediate Resistance: $3.20 (accumulation zone breakout)
- Key Resistance: $3.30 (first institutional resistance)
- Major Resistance: $3.50 (significant distribution zone)
---
Trading Scenarios and Setup Criteria
Scenario 1: Continuation Long Setup (PRIMARY)
Optimal Conditions for Long Entry:
- DEMA bullish maintenance: Black line remaining above orange line
- DMI confirmation: +DI sustaining dominance over -DI
- ADX persistence: Maintaining strong trending conditions above 40
- Volume respect: Price holding above $3.00 institutional core
- Momentum alignment: All timeframes confirming bullish bias
Entry Protocol:
- Primary Entry: Current levels $3.10-$3.15 (within institutional accumulation)
- Secondary Entry: $3.00-$3.05 on any pullback to core accumulation
- Position Sizing: Full 2% account risk given exceptional setup quality
- Stop Loss: Below $2.90 (institutional floor violation)
Profit Targets:
- Target 1: $3.35 (first institutional resistance) - Take 40% profits
- Target 2: $3.60 (major resistance zone) - Take 30% profits
- Target 3: $3.80-$4.00 (distribution zone approach) - Trail remaining 30%
Scenario 2: Pullback Accumulation Setup (SECONDARY)
Conditions for Pullback Entry:
- Price retracement to $3.00-$3.05 core accumulation zone
- DEMA holding bullish configuration during pullback
- Stochastic oversold providing tactical entry signal
- Volume profile respect at institutional support levels
Pullback Setup Parameters:
- Entry Range: $3.00-$3.05 (core institutional accumulation)
- Stop Loss: Below $2.90 (institutional positioning violation)
- Targets: Same as primary scenario with enhanced risk/reward
- Position Sizing: Maximum allocation given superior entry point
Scenario 3: Breakout Acceleration Setup (AGGRESSIVE)
Breakout Trading Framework:
- Breakout Level: Above $3.20 (accumulation zone upper boundary)
- Volume Confirmation: Increased volume supporting breakout move
- Technical Validation: DEMA gap expansion confirming momentum
- Momentum Persistence: ADX remaining above 40 with +DI dominance
Breakout Parameters:
- Entry: $3.22-$3.25 on confirmed breakout
- Stop: Below $3.10 (failed breakout)
- Accelerated Targets: $3.50, $3.75, $4.00+
- Position Management: Trail stops using institutional levels
---
Risk Management Protocols
Position Sizing Guidelines
Aggressive Approach (Recommended for NG):
- Maximum Risk: 2.5% of account (increased allocation due to exceptional setup quality)
- Contract Calculation: Account Size × 0.025 ÷ (Stop Distance × $10)
- Example: $100,000 account with $0.25 stop = 1,000 contracts maximum
- Rationale: Highest conviction setup justifies maximum allocation
Stop Loss Hierarchy
- Tactical Stop: $3.05 (execution chart support)
- Strategic Stop: $2.95 (institutional accumulation boundary)
- Emergency Stop: $2.85 (institutional floor violation)
Profit Management Framework
Systematic Profit Taking:
- First Target (40%): Lock in profits at institutional resistance
- Second Target (30%): Capture extended move through distribution zones
- Final Position (30%): Trail for potential acceleration beyond $4.00
- Trail Stop Method: Use $0.05 structure chart levels once in profit
---
Market Context and External Factors
Fundamental Catalysts Supporting Bullish Thesis
Supply/Demand Dynamics:
- Storage levels approaching seasonal norms
- Production discipline from major operators
- Export capacity utilization supporting demand
- Power generation baseload requirements
Seasonal Factors:
- Heating season demand preparation (September-October)
- Industrial consumption patterns shifting higher
- Weather derivatives market positioning for winter volatility
- LNG export commitments providing demand floor
Technical Market Structure
Commitment of Traders Alignment:
- Commercial hedgers reducing short positions
- Large speculators building long exposure
- Small traders exhibiting contrarian pessimism (bullish indicator)
- Open interest expansion confirming institutional participation
---
Monitoring Checklist and Alert Levels
Daily Monitoring Requirements
- DEMA Configuration: Maintain bullish black above orange relationship
- Institutional Respect: Confirm price behavior above $3.00 core zone
- Volume Analysis: Monitor for any changes in accumulation patterns
- External Events: EIA storage reports, weather forecasts, export data
- Correlation Tracking: Monitor relationship with heating oil and power prices
Critical Alert Levels
Bullish Escalation Alerts:
- Break above $3.20 with volume expansion
- DEMA gap expansion indicating acceleration
- +DI moving above 40 with ADX persistence above 50
- Weather forecasts showing early cold patterns
Risk Management Alerts:
- DEMA bearish crossover (black below orange)
- Break below $3.00 institutional core support
- ADX declining below 30 indicating momentum loss
- Negative storage surprise significantly above expectations
---
Strategic Outlook and Conviction Assessment
Risk/Reward Analysis
Exceptional Setup Characteristics:
- Risk: $0.25 to institutional floor ($2.90)
- Reward: $0.50+ to first major resistance ($3.60+)
- Risk/Reward Ratio: 2:1 minimum, potential 3:1+
- Probability Assessment: High (75%+) based on institutional alignment
Portfolio Allocation Recommendation
Maximum Conviction Positioning
Natural Gas represents the highest quality setup in the current market environment. The exceptional alignment between institutional accumulation and technical momentum, combined with supportive seasonal factors, justifies maximum allocation within risk management parameters. This setup exemplifies institutional intelligence-based trading at its finest - clear smart money positioning validated by technical execution signals.
Allocation Framework:
- Primary Portfolio Weight: 35-40% (maximum conviction)
- Entry Method: Scaled entry over 2-3 trading sessions
- Hold Period: Expect 2-6 week position duration
- Exit Strategy: Systematic profit-taking at institutional resistance levels
---
Conclusion and Strategic Assessment
Natural Gas presents a textbook example of institutional intelligence confirmed by technical momentum. The massive quarterly accumulation zone, combined with validated execution chart signals, creates optimal conditions for systematic position building. Current positioning within the institutional sweet spot offers exceptional risk/reward characteristics with clearly defined parameters for both profit-taking and risk management.
Implementation Priority: Immediate action recommended - this setup quality rarely presents itself with such clear institutional validation and technical confirmation.
Next Review: Daily monitoring of DEMA configuration and institutional level respect
Position Management: Systematic profit-taking protocol with trailing stops at institutional levels
---
Important Disclaimer
Risk Warning and Educational Purpose Statement
This analysis is provided for educational and informational purposes only and does not constitute financial advice, investment recommendations, or trading signals. All trading and investment decisions are solely the responsibility of the individual trader or investor.
Key Risk Considerations:
- Futures trading involves substantial risk of loss and is not suitable for all investors
- Past performance does not guarantee future results
- Market conditions can change rapidly, invalidating any analysis
- Leverage can amplify both profits and losses significantly
- Individual financial circumstances and risk tolerance vary greatly
Professional Guidance: Before making any trading decisions, consult with qualified financial advisors, conduct your own research, and ensure you fully understand the risks involved. Only trade with capital you can afford to lose.
Methodology Limitations: Volume profile analysis and technical indicators are tools for market assessment but are not infallible predictors of future price movement. Market dynamics include numerous variables that cannot be fully captured in any single analytical framework.
The views and analysis presented represent one interpretation of market data and should be considered alongside other forms of analysis and individual judgment.
Publications connexes
Clause de non-responsabilité
Les informations et publications ne sont pas destinées à être, et ne constituent pas, des conseils ou recommandations financiers, d'investissement, de trading ou autres fournis ou approuvés par TradingView. Pour en savoir plus, consultez les Conditions d'utilisation.