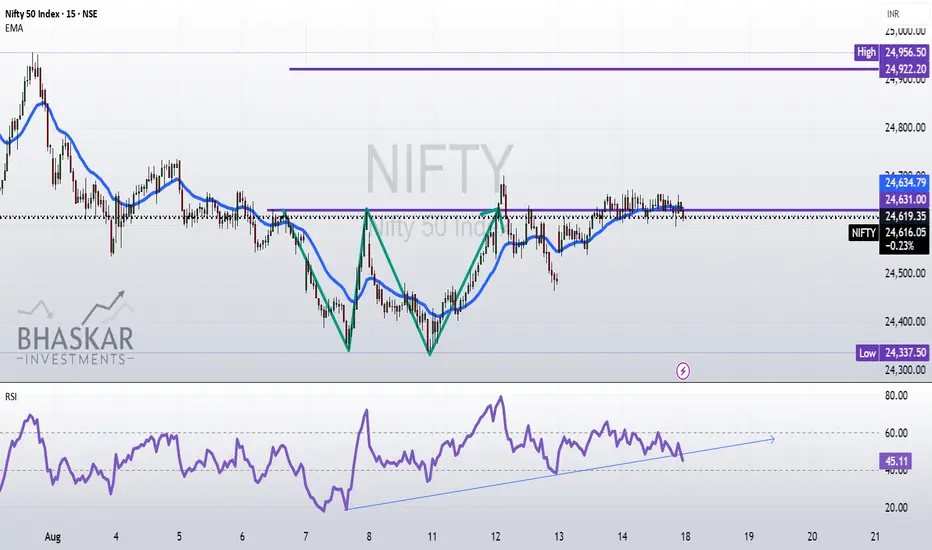
The NIFTY50 is currently displaying a bullish setup, characterized by the formation of a ‘W’ pattern on the chart. This structure is further supported by a strengthening Relative Strength Index (RSI), which indicates improving momentum. Additionally, the price action is aligning positively with the EMA20, reinforcing the potential for an upward move. Together, these technical signals suggest that NIFTY50 may experience bullish momentum in the near future.
Disclaimer:
I am NOT a SEBI registered advisor nor a financial advisor.
Any investments or trades I discuss on my blog are intended solely for educational purposes and do not represent specific financial, trading, or investment advice.
Disclosure:
I, the author of this report, and my immediate family members do not have any financial interest or beneficial ownership in the securities mentioned herein at the time of publication.
Note
A ‘W’ pattern shows that buyers are stepping in after the market has tested lower levels twice. When the price breaks above the middle peak (neckline), it usually moves up by the same height as the pattern. Once this target is reached, the W pattern is considered complete.Clause de non-responsabilité
Les informations et les publications ne sont pas destinées à être, et ne constituent pas, des conseils ou des recommandations en matière de finance, d'investissement, de trading ou d'autres types de conseils fournis ou approuvés par TradingView. Pour en savoir plus, consultez les Conditions d'utilisation.
Clause de non-responsabilité
Les informations et les publications ne sont pas destinées à être, et ne constituent pas, des conseils ou des recommandations en matière de finance, d'investissement, de trading ou d'autres types de conseils fournis ou approuvés par TradingView. Pour en savoir plus, consultez les Conditions d'utilisation.