VWAP Zone:
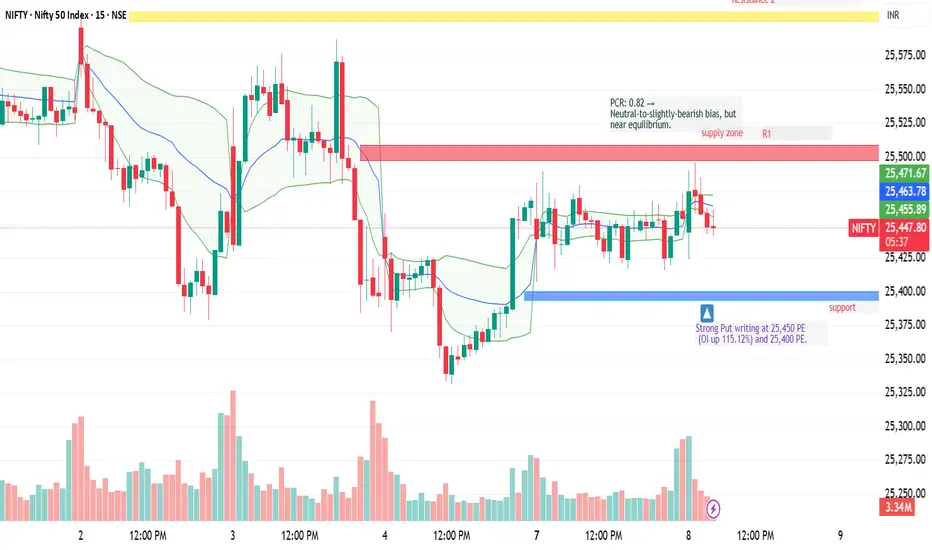
The VWAP lies at 25,456–25,464, acting as a dynamic resistance zone — price has failed to sustain above this level multiple times.
Price Pattern:
Multiple small-bodied candles with wicks indicate indecision and low momentum.
This suggests volatility compression — a breakout may follow.
Bollinger Bands:
Price hugging the middle band, with slightly narrowing bands — signals range contraction.
Clause de non-responsabilité
Les informations et les publications ne sont pas destinées à être, et ne constituent pas, des conseils ou des recommandations en matière de finance, d'investissement, de trading ou d'autres types de conseils fournis ou approuvés par TradingView. Pour en savoir plus, consultez les Conditions d'utilisation.