The Nifty closed on Tuesday, October 7, by sustaining its positive momentum, but faced strong resistance at the 25,200 level. This suggests bulls are struggling to break the supply zone quickly.
Detailed Market Structure Breakdown
4-Hour Chart (Macro Trend)
Structure: The Nifty is firmly in a bullish bounce phase, having established a strong reversal from the 24,600 base. The price is now trading within a clear ascending channel, and the strong upper wick on the recent 4H candle shows profit-booking and strong overhead supply from 25,150 - 25,250.
Key Levels:
Major Supply (Resistance): 25,150 - 25,250. This area is a significant FVG (Fair Value Gap) and a short-term Order Block (OB), making it a major hurdle. A breakout here is needed for the rally to extend toward 25,400.
Major Demand (Support): 24,900. This area is the first strong support, aligning with the rising trendline and a prior breakout level.
Outlook: The short-term bias is sideways-to-bullish. The market is expected to consolidate or correct shallowly before attempting another break of the supply zone.
1-Hour Chart (Intermediate View)
Structure: The 1H chart shows the market hitting the 25,200 resistance and facing a sharp rejection (indicated by the large upper wick and subsequent red candles). This confirms that sellers are active at the top of the range. The index is still in its ascending channel.
Key Levels:
Immediate Resistance: 25,200 (The high of Tuesday's session).
Immediate Support: 25,050 (Lower boundary of the ascending channel and a high-volume node).
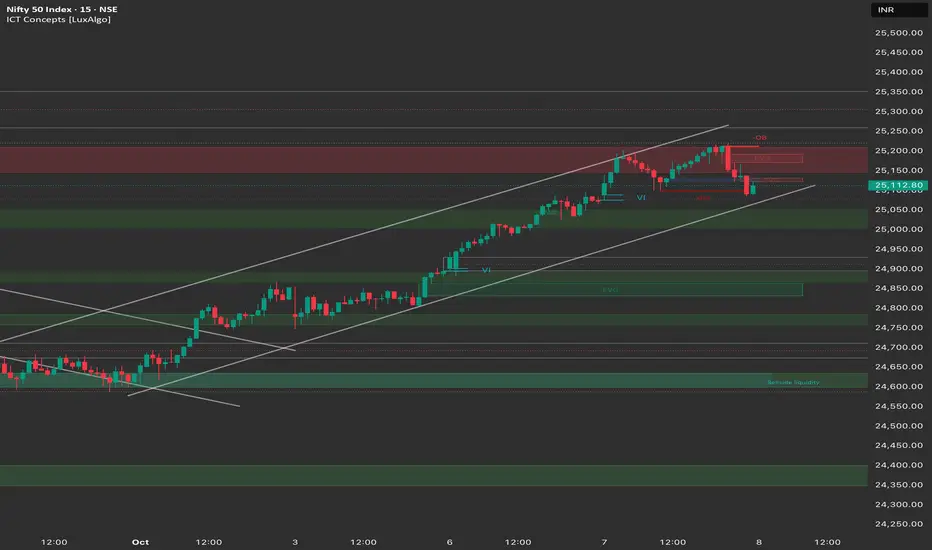
15-Minute Chart (Intraday View)
Structure: The 15M chart shows a short-term Market Structure Shift (MSS) to the downside in the last hour of trading, as the price broke a small swing low after failing to break 25,200. This suggests a minor intraday correction is likely for the start of Wednesday.
Key Levels:
Intraday Supply: 25,150 - 25,200.
Intraday Demand: 25,050.
Outlook: Slightly Bearish (Correction/Consolidation).
📈 Trade Plan (Wednesday, 8th October)
Market Outlook: Nifty is facing strong resistance at 25,200 and is due for a healthy consolidation or shallow correction. The strategy should be to buy on dips to the channel support or short a failure at the overhead resistance.
Bullish Scenario (Primary Plan: Buy on Dips)
Justification: The overall structure is bullish. The next move is likely a higher low.
Entry: Look for a long entry on a retest of the 25,000 - 25,050 support zone (lower channel trendline/FVG support) that shows a bullish reversal candle.
Stop Loss (SL): Place a stop loss below 24,950 (below the key Order Block).
Targets:
T1: 25,150 (Retest of supply zone).
T2: 25,250 (Breakout target).
Bearish Scenario (Counter-Trend: Short at Resistance/Breakdown)
Justification: Profit-booking at the 25,200 supply zone is strong.
Trigger 1 (Failure to Break): Short entry if 25,200 is tested and rejected with a bearish candle.
Trigger 2 (Breakdown): Short entry on a decisive break and 15-minute candle close below 25,050.
Stop Loss (SL): Above 25,250.
Targets:
T1: 24,950 (Immediate support).
T2: 24,850 (Major FVG support).
Key Levels for Observation:
Immediate Decision Point: 25,050 - 25,200 zone.
Bullish Confirmation: A break and sustained move above 25,250.
Bearish Warning: A move below 25,000 would suggest the correction is deepening.
Line in the Sand: 24,900. Below this level, the short-term uptrend is vulnerable.
Detailed Market Structure Breakdown
4-Hour Chart (Macro Trend)
Structure: The Nifty is firmly in a bullish bounce phase, having established a strong reversal from the 24,600 base. The price is now trading within a clear ascending channel, and the strong upper wick on the recent 4H candle shows profit-booking and strong overhead supply from 25,150 - 25,250.
Key Levels:
Major Supply (Resistance): 25,150 - 25,250. This area is a significant FVG (Fair Value Gap) and a short-term Order Block (OB), making it a major hurdle. A breakout here is needed for the rally to extend toward 25,400.
Major Demand (Support): 24,900. This area is the first strong support, aligning with the rising trendline and a prior breakout level.
Outlook: The short-term bias is sideways-to-bullish. The market is expected to consolidate or correct shallowly before attempting another break of the supply zone.
1-Hour Chart (Intermediate View)
Structure: The 1H chart shows the market hitting the 25,200 resistance and facing a sharp rejection (indicated by the large upper wick and subsequent red candles). This confirms that sellers are active at the top of the range. The index is still in its ascending channel.
Key Levels:
Immediate Resistance: 25,200 (The high of Tuesday's session).
Immediate Support: 25,050 (Lower boundary of the ascending channel and a high-volume node).
15-Minute Chart (Intraday View)
Structure: The 15M chart shows a short-term Market Structure Shift (MSS) to the downside in the last hour of trading, as the price broke a small swing low after failing to break 25,200. This suggests a minor intraday correction is likely for the start of Wednesday.
Key Levels:
Intraday Supply: 25,150 - 25,200.
Intraday Demand: 25,050.
Outlook: Slightly Bearish (Correction/Consolidation).
📈 Trade Plan (Wednesday, 8th October)
Market Outlook: Nifty is facing strong resistance at 25,200 and is due for a healthy consolidation or shallow correction. The strategy should be to buy on dips to the channel support or short a failure at the overhead resistance.
Bullish Scenario (Primary Plan: Buy on Dips)
Justification: The overall structure is bullish. The next move is likely a higher low.
Entry: Look for a long entry on a retest of the 25,000 - 25,050 support zone (lower channel trendline/FVG support) that shows a bullish reversal candle.
Stop Loss (SL): Place a stop loss below 24,950 (below the key Order Block).
Targets:
T1: 25,150 (Retest of supply zone).
T2: 25,250 (Breakout target).
Bearish Scenario (Counter-Trend: Short at Resistance/Breakdown)
Justification: Profit-booking at the 25,200 supply zone is strong.
Trigger 1 (Failure to Break): Short entry if 25,200 is tested and rejected with a bearish candle.
Trigger 2 (Breakdown): Short entry on a decisive break and 15-minute candle close below 25,050.
Stop Loss (SL): Above 25,250.
Targets:
T1: 24,950 (Immediate support).
T2: 24,850 (Major FVG support).
Key Levels for Observation:
Immediate Decision Point: 25,050 - 25,200 zone.
Bullish Confirmation: A break and sustained move above 25,250.
Bearish Warning: A move below 25,000 would suggest the correction is deepening.
Line in the Sand: 24,900. Below this level, the short-term uptrend is vulnerable.
Clause de non-responsabilité
Les informations et publications ne sont pas destinées à être, et ne constituent pas, des conseils ou recommandations financiers, d'investissement, de trading ou autres fournis ou approuvés par TradingView. Pour en savoir plus, consultez les Conditions d'utilisation.
Clause de non-responsabilité
Les informations et publications ne sont pas destinées à être, et ne constituent pas, des conseils ou recommandations financiers, d'investissement, de trading ou autres fournis ou approuvés par TradingView. Pour en savoir plus, consultez les Conditions d'utilisation.