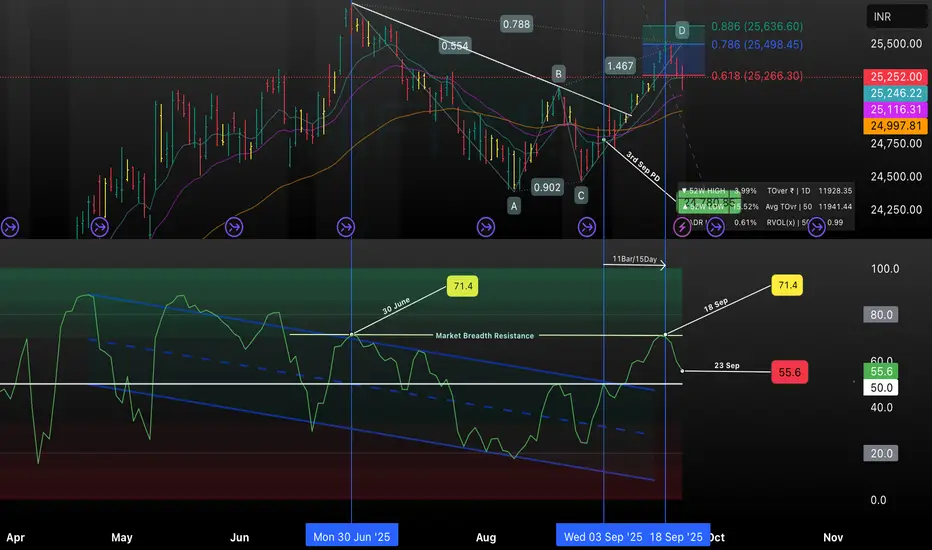
This chart highlights a bearish harmonic setup forming on NIFTY’s daily timeframe, with key confluence at the 0.618 and 0.786 Fibonacci retracement levels. A descending trendline and ABCD points are marked, exposing short-term reversal probability. The RSI indicator shows clear rejection at the 71.4 ‘Market Breadth Resistance’ zone on both June 30 and September 18, 2025, followed by a sharp drop to 55.6 as of September 23. This confluence signals caution for bullish momentum, with support/resistance and volume metrics also annotated for clarity.
Clause de non-responsabilité
Les informations et publications ne sont pas destinées à être, et ne constituent pas, des conseils ou recommandations financiers, d'investissement, de trading ou autres fournis ou approuvés par TradingView. Pour en savoir plus, consultez les Conditions d'utilisation.
Clause de non-responsabilité
Les informations et publications ne sont pas destinées à être, et ne constituent pas, des conseils ou recommandations financiers, d'investissement, de trading ou autres fournis ou approuvés par TradingView. Pour en savoir plus, consultez les Conditions d'utilisation.