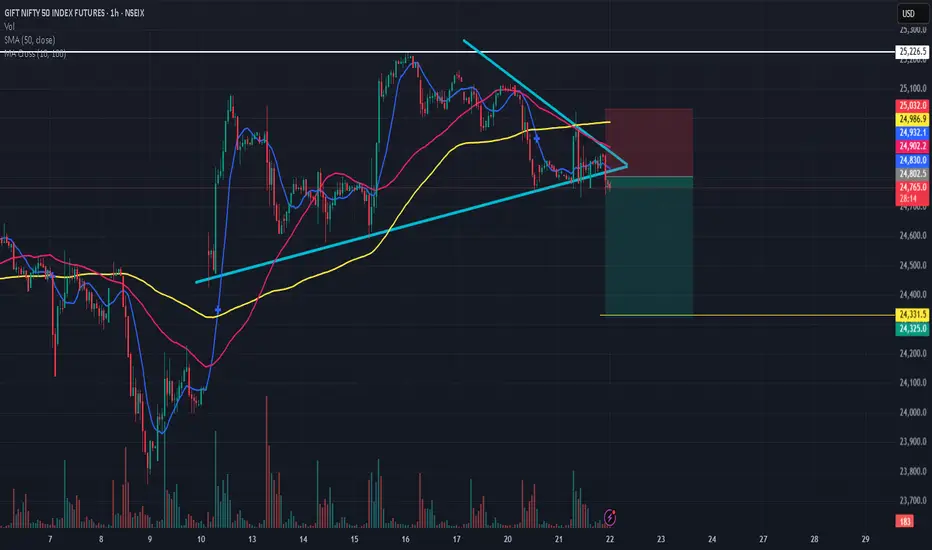
A triangle chart pattern is a tool used in technical analysis. Named for its resemblance to a series of triangles, the triangle chart pattern is created by drawing trendlines along a converging price range. The result signals a pause in the prevailing trend.
Technical analysts read the triangle as an indicator of a continuation of an existing trend or reversal.
Despite being a continuation, traders should look for breakouts before they make a move to buy or sell.
Technical analysts read the triangle as an indicator of a continuation of an existing trend or reversal.
Despite being a continuation, traders should look for breakouts before they make a move to buy or sell.
Clause de non-responsabilité
Les informations et les publications ne sont pas destinées à être, et ne constituent pas, des conseils ou des recommandations en matière de finance, d'investissement, de trading ou d'autres types de conseils fournis ou approuvés par TradingView. Pour en savoir plus, consultez les Conditions d'utilisation.