NMDC looks to be setting up for a potential impulsive rally after completing a corrective wave. The structure suggests strength, with protective levels clearly defined.
🧩 Elliott Wave Structure
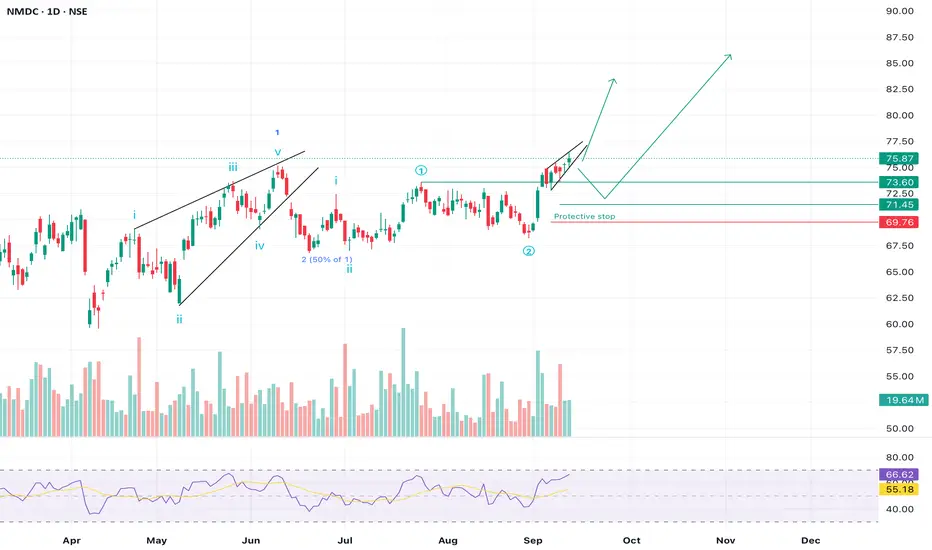
• We can see a completed 5-wave move up earlier this year (Wave 1).
• That was followed by a healthy correction (Wave 2), which retraced close to 50% of Wave 1 — a textbook retracement zone.
• Now, price action is forming a new Wave 3 setup, which tends to be the strongest move in Elliott Wave cycles.
📈 Key Levels to Watch
• Current Price: ₹75.87
• Immediate Support: ₹73.60 – ₹73.37 zone
• Protective Stop: ₹71.45 (below recent swing low, Wave 2 invalidation area)
• Upside Path: If price sustains above ₹76, we may see a quick move towards ₹80–82 first, and eventually ₹85+ in the coming weeks.
🔍 Technical Indicators
✅ RSI is rising and trading around 66, showing bullish momentum but still shy of overbought levels.
✅ Moving averages are sloping upward, supporting the bullish bias.
✅ Volume spikes on green candles indicate strong participation from buyers.
📊 Possible Scenarios
1. Bullish Continuation: A breakout above ₹76 could trigger momentum buying, leading to higher targets quickly.
2. Pullback Before Rally: Price may retest the ₹73–74 zone before resuming the uptrend — a healthy retest would make the rally stronger.
Protective stop is marked near ₹71.45. If price falls below this, it may indicate that the wave structure has failed, and deeper correction could follow.
⸻
Disclaimer:
This analysis is for educational purposes only and not investment advice. Please consult a SEBI-registered financial advisor before making any trading or investing decisions.
🧩 Elliott Wave Structure
• We can see a completed 5-wave move up earlier this year (Wave 1).
• That was followed by a healthy correction (Wave 2), which retraced close to 50% of Wave 1 — a textbook retracement zone.
• Now, price action is forming a new Wave 3 setup, which tends to be the strongest move in Elliott Wave cycles.
📈 Key Levels to Watch
• Current Price: ₹75.87
• Immediate Support: ₹73.60 – ₹73.37 zone
• Protective Stop: ₹71.45 (below recent swing low, Wave 2 invalidation area)
• Upside Path: If price sustains above ₹76, we may see a quick move towards ₹80–82 first, and eventually ₹85+ in the coming weeks.
🔍 Technical Indicators
✅ RSI is rising and trading around 66, showing bullish momentum but still shy of overbought levels.
✅ Moving averages are sloping upward, supporting the bullish bias.
✅ Volume spikes on green candles indicate strong participation from buyers.
📊 Possible Scenarios
1. Bullish Continuation: A breakout above ₹76 could trigger momentum buying, leading to higher targets quickly.
2. Pullback Before Rally: Price may retest the ₹73–74 zone before resuming the uptrend — a healthy retest would make the rally stronger.
Protective stop is marked near ₹71.45. If price falls below this, it may indicate that the wave structure has failed, and deeper correction could follow.
⸻
Disclaimer:
This analysis is for educational purposes only and not investment advice. Please consult a SEBI-registered financial advisor before making any trading or investing decisions.
Clause de non-responsabilité
Les informations et publications ne sont pas destinées à être, et ne constituent pas, des conseils ou recommandations financiers, d'investissement, de trading ou autres fournis ou approuvés par TradingView. Pour en savoir plus, consultez les Conditions d'utilisation.
Clause de non-responsabilité
Les informations et publications ne sont pas destinées à être, et ne constituent pas, des conseils ou recommandations financiers, d'investissement, de trading ou autres fournis ou approuvés par TradingView. Pour en savoir plus, consultez les Conditions d'utilisation.