Instrument: NASDAQ 100 E-mini Futures (NQ)
Bias: Short-term corrective downside after a completed impulse, then continuation higher.
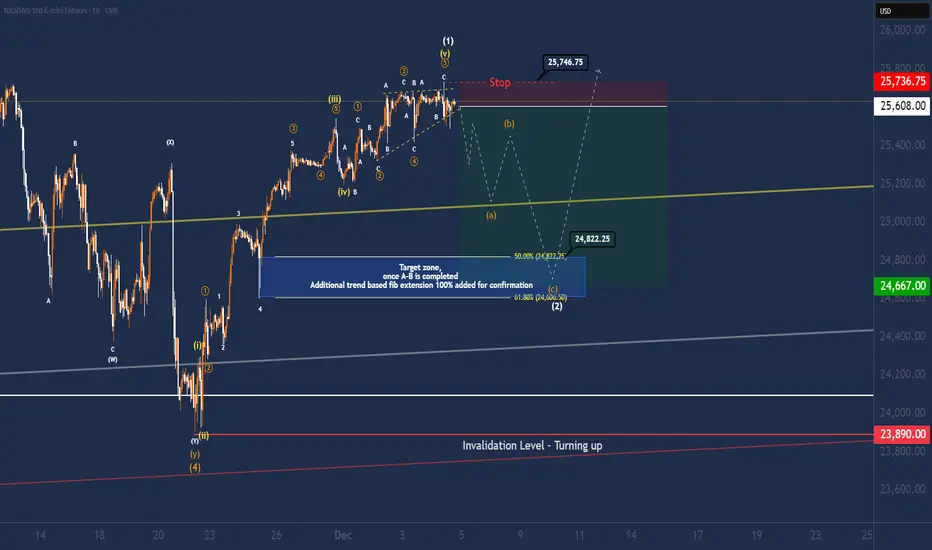
1. Bigger picture – why I expect a correction
From the low around 23,890 we’ve put in a very clean 5-wave impulsive advance:
* Wave (i)–(ii) starts the move off the low.
* Wave (iii) is clearly the strongest and longest leg – classic extended 3rd wave behaviour.
* Wave (iv) is a shallow sideways consolidation.
* The current high is labelled (1), with the last leg subdividing as an ending diagonal in wave (v): overlapping structure, contracting highs, and loss of momentum.
That wedge-type structure at the top usually signals trend exhaustion, not the start of fresh impulsive upside. So my base case is that the first motive wave up from 23,890 is complete and we’re now looking for a textbook wave (2) pullback. We also can back this data up with volume nodes we can observe during the NY Cash sessions. Who are clearly showing signs of distribution.
Wave (2) corrections most often retrace 50–61.8% of wave (1) in a 3-wave A-B-C structure – exactly what the chart is projecting.
2. Expected path – the A-B-C into the blue box
From the current highs around 25,600–25,700 I’m looking for:
1. Wave (a) down
First impulsive leg lower, ideally breaking out of the wedge and pushing into the rising yellow trendline zone around ±25,200.
2. Wave (b) retrace up
Corrective bounce that stays below the stop zone and forms a lower high.
3. Wave (c) down into the blue box
Final flush into the confluence zone marked in blue, where:
This blue rectangle is my primary target area for the current correction and also my preferred zone to look for fresh longs if the structure behaves as expected.
4. Trade idea #1 – Aggressive short from the wedge
This is the “catch the correction” play for traders comfortable trading against the higher-timeframe trend.
Idea: Short against the completed wedge / wave (1) high, targeting the A-B-C correction into the blue zone.
Entry zone:
Around current prices in the 25,580–25,600 area (wedge top / prior minor highs).
Stop-loss (hard invalidation for the short):
Above the red “Stop” band and the labelled high at 25,746.75
If price breaks and holds above this level, the idea of a completed wave (1) and immediate correction is likely wrong – stand aside.
Profit targets:
TP1 – first leg / (A) completion:
Around the rising yellow trendline near 25,150–25,250
Take some off here if you want to pay yourself on the initial impulse.
TP2 – upper edge of blue box (50% fib): 24,822.25
TP3 – lower edge of blue box (61.8% fib & (c) completion): 24,600–24,650 are
For reference, using an approximate entry at 25,600:
So the idea offers an attractive reward:risk, as long as you accept the possibility that the correction may be shallower or more complex than the “ideal” projection.
What I want to see step-by-step if I’m in this short:
1. A convincing break down out of the wedge.
2. Follow-through selling to the yellow trendline (wave (a)).
3. A choppy overlapping bounce that stalls under the stop zone (wave (b)).
4. One more push down with increasing momentum into the blue box (wave (c)) – where I’ll look to exit shorts and flip bias.
5. Trade idea #2 – Conservative swing long from the blue box
If you don’t like shorting a strong trend, the more conservative plan is to ignore the short and only look for longs once the correction has played out.
Idea:
Buy the end of wave (2) in the blue box for a continuation higher in wave (3).
So we are trying to buy the dip in a strong trend.
Buy zone (long trigger area):
Blue box between roughly 24,800–24,600.
Ideally after we’ve seen a full A-B-C structure into this zone and some kind of reaction. (rejection wicks, bullish divergence, lower-timeframe 5-wave impulse off the lows, etc.).It could also be a more complex correction like WXY, However most of the time we expect a wave 2 more str8 forward price action.
Stop-loss for the long:
Upside objectives:
6. Invalidation and what would change my mind
Short-term bearish idea is invalid:
if price closes decisively above 25,75x without first breaking down. That would suggest that wave (1) is still extending, or that we’re in a different pattern (e.g. a larger ending diagonal or a complex topping structure). In that case I step aside and reassess.
Medium-term bullish roadmap is invalid if price trades below 23,890. Then the whole impulse from the low is likely mis-labelled and I would expect a deeper bearish structure. However this
7. Final notes
This is an Elliott Wave–driven roadmap, not a guarantee. I’m planning to:
As always: manage your risk, size appropriately, and don’t trade this blindly. This is a trade idea and educational analysis, not financial advice.
Since lack of time I was not able to post many trade ideas in the past months. However I'm going to try to get back some more ideas in the future! Please leave feedback and comments!
Bias: Short-term corrective downside after a completed impulse, then continuation higher.
1. Bigger picture – why I expect a correction
From the low around 23,890 we’ve put in a very clean 5-wave impulsive advance:
* Wave (i)–(ii) starts the move off the low.
* Wave (iii) is clearly the strongest and longest leg – classic extended 3rd wave behaviour.
* Wave (iv) is a shallow sideways consolidation.
* The current high is labelled (1), with the last leg subdividing as an ending diagonal in wave (v): overlapping structure, contracting highs, and loss of momentum.
That wedge-type structure at the top usually signals trend exhaustion, not the start of fresh impulsive upside. So my base case is that the first motive wave up from 23,890 is complete and we’re now looking for a textbook wave (2) pullback. We also can back this data up with volume nodes we can observe during the NY Cash sessions. Who are clearly showing signs of distribution.
Wave (2) corrections most often retrace 50–61.8% of wave (1) in a 3-wave A-B-C structure – exactly what the chart is projecting.
2. Expected path – the A-B-C into the blue box
From the current highs around 25,600–25,700 I’m looking for:
1. Wave (a) down
First impulsive leg lower, ideally breaking out of the wedge and pushing into the rising yellow trendline zone around ±25,200.
2. Wave (b) retrace up
Corrective bounce that stays below the stop zone and forms a lower high.
3. Wave (c) down into the blue box
Final flush into the confluence zone marked in blue, where:
- 50% retrace of wave (1) sits around 24,800.
- 61.8% retrace sits around 24,600
- There’s also a previous structural support / prior wave-4 area.
- Labelled as the end of wave (2) on the chart.
This blue rectangle is my primary target area for the current correction and also my preferred zone to look for fresh longs if the structure behaves as expected.
4. Trade idea #1 – Aggressive short from the wedge
This is the “catch the correction” play for traders comfortable trading against the higher-timeframe trend.
Idea: Short against the completed wedge / wave (1) high, targeting the A-B-C correction into the blue zone.
Entry zone:
Around current prices in the 25,580–25,600 area (wedge top / prior minor highs).
Stop-loss (hard invalidation for the short):
Above the red “Stop” band and the labelled high at 25,746.75
If price breaks and holds above this level, the idea of a completed wave (1) and immediate correction is likely wrong – stand aside.
Profit targets:
TP1 – first leg / (A) completion:
Around the rising yellow trendline near 25,150–25,250
Take some off here if you want to pay yourself on the initial impulse.
TP2 – upper edge of blue box (50% fib): 24,822.25
TP3 – lower edge of blue box (61.8% fib & (c) completion): 24,600–24,650 are
For reference, using an approximate entry at 25,600:
- Risk: 25,740. – 25,600 ≈ 138.75 pts
- Reward to TP2: 25,600 – 24,800 ≈ 780 pts (~5.7R)
- Reward to TP3: 25,600 – 24,660 ≈ 940 pts (~6.8R)
So the idea offers an attractive reward:risk, as long as you accept the possibility that the correction may be shallower or more complex than the “ideal” projection.
What I want to see step-by-step if I’m in this short:
1. A convincing break down out of the wedge.
2. Follow-through selling to the yellow trendline (wave (a)).
3. A choppy overlapping bounce that stalls under the stop zone (wave (b)).
4. One more push down with increasing momentum into the blue box (wave (c)) – where I’ll look to exit shorts and flip bias.
5. Trade idea #2 – Conservative swing long from the blue box
If you don’t like shorting a strong trend, the more conservative plan is to ignore the short and only look for longs once the correction has played out.
Idea:
Buy the end of wave (2) in the blue box for a continuation higher in wave (3).
So we are trying to buy the dip in a strong trend.
Buy zone (long trigger area):
Blue box between roughly 24,800–24,600.
Ideally after we’ve seen a full A-B-C structure into this zone and some kind of reaction. (rejection wicks, bullish divergence, lower-timeframe 5-wave impulse off the lows, etc.).It could also be a more complex correction like WXY, However most of the time we expect a wave 2 more str8 forward price action.
Stop-loss for the long:
- Conservative, structure-based invalidation remains the red line at 23,890
- A break below this low would invalidate the wave (1)–(2) interpretation and suggest something more bearish is underway.
- Tactically, some traders may opt for a tighter stop just below the blue box (e.g. under 24,550), but that’s a money-management choice, not a structural one.
Upside objectives:
- First objective is a retest and break of the 25,746 high.
- From there, if this is indeed the start of wave (3), extensions towards **26,000+** become realistic (1.0–1.618 extensions of wave (1), not drawn in detail here but implied by the dashed grey path).
6. Invalidation and what would change my mind
Short-term bearish idea is invalid:
if price closes decisively above 25,75x without first breaking down. That would suggest that wave (1) is still extending, or that we’re in a different pattern (e.g. a larger ending diagonal or a complex topping structure). In that case I step aside and reassess.
Medium-term bullish roadmap is invalid if price trades below 23,890. Then the whole impulse from the low is likely mis-labelled and I would expect a deeper bearish structure. However this
7. Final notes
This is an Elliott Wave–driven roadmap, not a guarantee. I’m planning to:
- Treat the current region as exhaustion of wave (1).
- Use it either for an aggressive short into the A-B-C correction,
- Or wait patiently for the blue box to develop for a more conservative long into a potential wave (3).
As always: manage your risk, size appropriately, and don’t trade this blindly. This is a trade idea and educational analysis, not financial advice.
Since lack of time I was not able to post many trade ideas in the past months. However I'm going to try to get back some more ideas in the future! Please leave feedback and comments!
Nederlandse trading en investerings community voor en door traders;
Leren - nieuws - Technische analyses
deretailtraders.nl
Leren - nieuws - Technische analyses
deretailtraders.nl
Clause de non-responsabilité
Les informations et publications ne sont pas destinées à être, et ne constituent pas, des conseils ou recommandations financiers, d'investissement, de trading ou autres fournis ou approuvés par TradingView. Pour en savoir plus, consultez les Conditions d'utilisation.