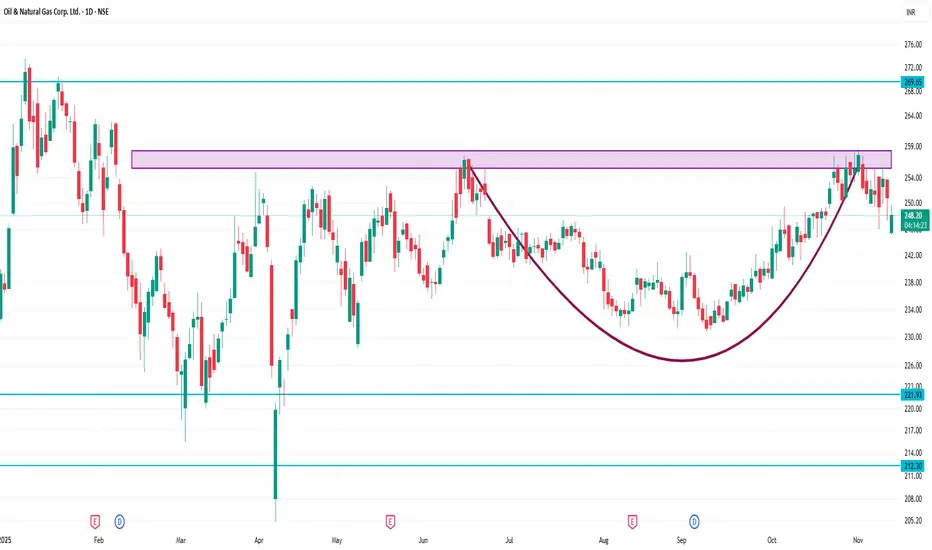
🎯 Key levels to watch on the 1-day chart
Support zone: ~ ₹ 245-243 region (falls in line with support zones and moving average base)
Near support: ~ ₹ 248-250 (if price returns toward pivot/support)
Resistance zone: ~ ₹ 253-257 region (prior resistance, pivot R1, chart resistance).
If ONGC breaks above ~₹ 257 with conviction, next higher resistance might be ~ ₹ 260+ (depending on trend).
If ONGC breaks down below ~₹ 243 (support zone) with volume, possible further drop toward ~₹ 241 or ~₹ 225 in longer term.
Publications connexes
Clause de non-responsabilité
Les informations et publications ne sont pas destinées à être, et ne constituent pas, des conseils ou recommandations financiers, d'investissement, de trading ou autres fournis ou approuvés par TradingView. Pour en savoir plus, consultez les Conditions d'utilisation.