Hydrogen-fuel firm Plug Power  PLUG rallied 225% from its Sept. 10 low to its Oct. 6 high, then fell some 25% over less than three sessions before climbing back some 15% just on Monday. And PLUG is down more than 99% from its all-time high some 26 years ago. One thing's for sure -- it's not a boring stock.
What does PLUG's technical and fundamental analysis say might happen next? Let's see:
Plug Power's Fundamental Analysis
PLUG, which sells eco-friendly "green" hydrogen fuel and related systems, has seen multiple catalysts in just the past week alone.
For instance, the firm announced on Oct. 1 that it delivered the company's first 10 MW GenEco electrolyzer array to the Galp Sines Refinery in Portugal -- Europe's largest proton-exchange-membrane hydrogen-electrolyzer project.
Two days later, HC Wainwright analyst Amit Dayal (rated at four stars out of a possible five by TipRanks) reiterated his "Buy" rating on PLUG while increasing the stock's price target to $7 from a previous $3. (The stock closed at $3.90 on Monday.)
And on Oct. 7, PLUG announced that its board appointed Jose Luis Crespo as new CEO, taking over for current chief Andy Marsh (who's staying on as executive chair). Crespo previously served as PLUG's chief revenue officer.
Then on Oct. 8, the firm announced a warrant-inducement agreement with a single institutional investor for the immediate exercise of the entirety of the company's outstanding warrants issued in March 2025 to purchase 185.43 million shares of common stock. The exercise price was $2 a share, which will raise more than $370 million for PLUG.
In exchange, the investor received 31 million shares of PLUG stock and pre-funded warrants to purchase up to 154.4 million shares more at $7.75 apiece. (The investor can settle up beginning in March 2026.)
All of this happened about a month before Wall Street expects PLUG to release fiscal Q3 financial results.
The Street is looking for a $0.13 GAAP loss per share on roughly $185.4 million of revenue. That would represent about a 45% improvement from the $0.24 loss per share the PLUG saw in the year ago period, as well as about a 7% gain from the $173.3 million the firm recorded in year-ago sales.
Of the 18 sell-side analysts that I know of that cover PLUG, eight have revised their earnings estimates higher since current quarter began, while seven have cut their numbers. (Three analysts have left their estimates unchanged.)
Plug Power's Technical Analysis
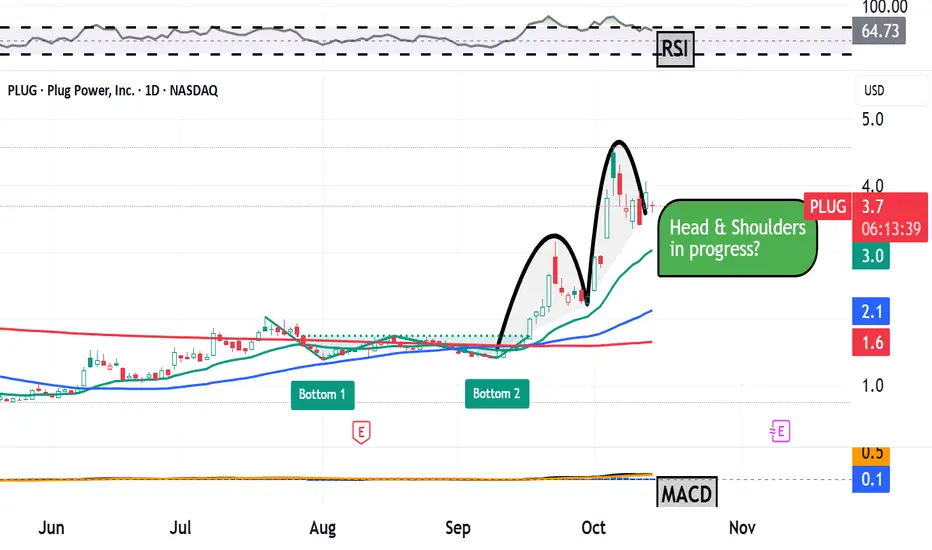
Next, let's look at PLUG's chart going back some five months and running through Thursday afternoon:

Readers will see that PLUG blasted out of a double-bottom pattern of bullish reversal in September, marked by two curving black lines at the chart's right.
However, the above rally and subsequent sell-off looks to me more like an incomplete head-and-shoulders pattern that's maybe about two-thirds of the way into its development. That would be a bearish set-up.
Then again, there's a reason that many traders wait to see patterns complete their development. Sometimes, patterns simply don't end up developing.
Oh, and did I mention that short-sellers make up some 31% of PLUG's entire float?
As for PLUG's secondary technical indicators, the stock's Relative Strength Index (or "RSI," the gray line at the chart's top) is running at elevated levels, but off of its recent highs.
Meanwhile, Plug Power's daily Moving Average Convergence Divergence indicator (or "MACD," marked with black and gold lines and blue bars at the chart's bottom) looks very bullish.
For instance, the histogram of the stock's 9-day Exponential Moving Average (or "EMA," denoted by blue bars) is running above the zero-bound and has been since mid-September.
The same goes for the 12-day EMA (black line) and 26-day EMA (gold line), with the black line running above the gold line. That's a short- to medium-term bullish signal.
An Options Option
Aggressive options traders who want to go long PLUG heading into earnings (or who see the potential for a short squeeze) might purchase the stock while selling naked puts to potentially lower their cost basis in this scenario. Here's an example:
-- Buy 100 shares of PLUG at or close to $3.90 a share.
-- Sell one Nov. 14 $3.50 put for about $0.45. This put will likely expire after PLUG's Q3 earnings report.
-- Sell one Nov. 14 $3 put for about $0.25.
Net Basis: $3.20
This options spread means the investor will have essentially bought PLUG for about an 18% discount from market prices, thanks to the put premiums received (assuming shares go higher, or at least don't go below $3.50 by expiration).
However, the sale of naked puts does expose the investor to significant risk, as the stock could theoretically fall to zero.
Should the shares go lower than $3.50 before the puts expire, the investor could wind up long 200 PLUG shares of at a $3.35 net basis at a time when the shares are trading below $3.50.
And if PLUG falls below $3 before the puts run out, the trader could end up long 300 shares at a $3.23 net basis when PLUG is trading below $3.
(Moomoo Technologies Inc. Markets Commentator Stephen "Sarge" Guilfoyle had no position in PLUG at the time of writing this column.)
This article discusses technical analysis, other approaches, including fundamental analysis, may offer very different views. The examples provided are for illustrative purposes only and are not intended to be reflective of the results you can expect to achieve. Specific security charts used are for illustrative purposes only and are not a recommendation, offer to sell, or a solicitation of an offer to buy any security. Past investment performance does not indicate or guarantee future success. Returns will vary, and all investments carry risks, including loss of principal. This content is also not a research report and is not intended to serve as the basis for any investment decision. The information contained in this article does not purport to be a complete description of the securities, markets, or developments referred to in this material. Moomoo and its affiliates make no representation or warranty as to the article's adequacy, completeness, accuracy or timeliness for any particular purpose of the above content. Furthermore, there is no guarantee that any statements, estimates, price targets, opinions or forecasts provided herein will prove to be correct.
Options trading is risky and not appropriate for everyone. Read the Options Disclosure Document (https://j.moomoo.com/017y9J) before trading. Options are complex and you may quickly lose the entire investment. Supporting docs for any claims will be furnished upon request.
Options trading subject to eligibility requirements. Strategies available will depend on options level approved.
The Analyst Ratings feature comes from TipRanks, an independent third party. The accuracy, completeness, or reliability cannot be guaranteed and should not be relied upon as a primary basis for any investment decision. The target prices are intended for informational purposes only, not recommendations, and are also not guarantees of future results.
Moomoo is a financial information and trading app offered by Moomoo Technologies Inc. In the U.S., investment products and services on Moomoo are offered by Moomoo Financial Inc., Member FINRA/SIPC.
TradingView is an independent third party not affiliated with Moomoo Financial Inc., Moomoo Technologies Inc., or its affiliates. Moomoo Financial Inc. and its affiliates do not endorse, represent or warrant the completeness and accuracy of the data and information available on the TradingView platform and are not responsible for any services provided by the third-party platform.
What does PLUG's technical and fundamental analysis say might happen next? Let's see:
Plug Power's Fundamental Analysis
PLUG, which sells eco-friendly "green" hydrogen fuel and related systems, has seen multiple catalysts in just the past week alone.
For instance, the firm announced on Oct. 1 that it delivered the company's first 10 MW GenEco electrolyzer array to the Galp Sines Refinery in Portugal -- Europe's largest proton-exchange-membrane hydrogen-electrolyzer project.
Two days later, HC Wainwright analyst Amit Dayal (rated at four stars out of a possible five by TipRanks) reiterated his "Buy" rating on PLUG while increasing the stock's price target to $7 from a previous $3. (The stock closed at $3.90 on Monday.)
And on Oct. 7, PLUG announced that its board appointed Jose Luis Crespo as new CEO, taking over for current chief Andy Marsh (who's staying on as executive chair). Crespo previously served as PLUG's chief revenue officer.
Then on Oct. 8, the firm announced a warrant-inducement agreement with a single institutional investor for the immediate exercise of the entirety of the company's outstanding warrants issued in March 2025 to purchase 185.43 million shares of common stock. The exercise price was $2 a share, which will raise more than $370 million for PLUG.
In exchange, the investor received 31 million shares of PLUG stock and pre-funded warrants to purchase up to 154.4 million shares more at $7.75 apiece. (The investor can settle up beginning in March 2026.)
All of this happened about a month before Wall Street expects PLUG to release fiscal Q3 financial results.
The Street is looking for a $0.13 GAAP loss per share on roughly $185.4 million of revenue. That would represent about a 45% improvement from the $0.24 loss per share the PLUG saw in the year ago period, as well as about a 7% gain from the $173.3 million the firm recorded in year-ago sales.
Of the 18 sell-side analysts that I know of that cover PLUG, eight have revised their earnings estimates higher since current quarter began, while seven have cut their numbers. (Three analysts have left their estimates unchanged.)
Plug Power's Technical Analysis
Next, let's look at PLUG's chart going back some five months and running through Thursday afternoon:
Readers will see that PLUG blasted out of a double-bottom pattern of bullish reversal in September, marked by two curving black lines at the chart's right.
However, the above rally and subsequent sell-off looks to me more like an incomplete head-and-shoulders pattern that's maybe about two-thirds of the way into its development. That would be a bearish set-up.
Then again, there's a reason that many traders wait to see patterns complete their development. Sometimes, patterns simply don't end up developing.
Oh, and did I mention that short-sellers make up some 31% of PLUG's entire float?
As for PLUG's secondary technical indicators, the stock's Relative Strength Index (or "RSI," the gray line at the chart's top) is running at elevated levels, but off of its recent highs.
Meanwhile, Plug Power's daily Moving Average Convergence Divergence indicator (or "MACD," marked with black and gold lines and blue bars at the chart's bottom) looks very bullish.
For instance, the histogram of the stock's 9-day Exponential Moving Average (or "EMA," denoted by blue bars) is running above the zero-bound and has been since mid-September.
The same goes for the 12-day EMA (black line) and 26-day EMA (gold line), with the black line running above the gold line. That's a short- to medium-term bullish signal.
An Options Option
Aggressive options traders who want to go long PLUG heading into earnings (or who see the potential for a short squeeze) might purchase the stock while selling naked puts to potentially lower their cost basis in this scenario. Here's an example:
-- Buy 100 shares of PLUG at or close to $3.90 a share.
-- Sell one Nov. 14 $3.50 put for about $0.45. This put will likely expire after PLUG's Q3 earnings report.
-- Sell one Nov. 14 $3 put for about $0.25.
Net Basis: $3.20
This options spread means the investor will have essentially bought PLUG for about an 18% discount from market prices, thanks to the put premiums received (assuming shares go higher, or at least don't go below $3.50 by expiration).
However, the sale of naked puts does expose the investor to significant risk, as the stock could theoretically fall to zero.
Should the shares go lower than $3.50 before the puts expire, the investor could wind up long 200 PLUG shares of at a $3.35 net basis at a time when the shares are trading below $3.50.
And if PLUG falls below $3 before the puts run out, the trader could end up long 300 shares at a $3.23 net basis when PLUG is trading below $3.
(Moomoo Technologies Inc. Markets Commentator Stephen "Sarge" Guilfoyle had no position in PLUG at the time of writing this column.)
This article discusses technical analysis, other approaches, including fundamental analysis, may offer very different views. The examples provided are for illustrative purposes only and are not intended to be reflective of the results you can expect to achieve. Specific security charts used are for illustrative purposes only and are not a recommendation, offer to sell, or a solicitation of an offer to buy any security. Past investment performance does not indicate or guarantee future success. Returns will vary, and all investments carry risks, including loss of principal. This content is also not a research report and is not intended to serve as the basis for any investment decision. The information contained in this article does not purport to be a complete description of the securities, markets, or developments referred to in this material. Moomoo and its affiliates make no representation or warranty as to the article's adequacy, completeness, accuracy or timeliness for any particular purpose of the above content. Furthermore, there is no guarantee that any statements, estimates, price targets, opinions or forecasts provided herein will prove to be correct.
Options trading is risky and not appropriate for everyone. Read the Options Disclosure Document (https://j.moomoo.com/017y9J) before trading. Options are complex and you may quickly lose the entire investment. Supporting docs for any claims will be furnished upon request.
Options trading subject to eligibility requirements. Strategies available will depend on options level approved.
The Analyst Ratings feature comes from TipRanks, an independent third party. The accuracy, completeness, or reliability cannot be guaranteed and should not be relied upon as a primary basis for any investment decision. The target prices are intended for informational purposes only, not recommendations, and are also not guarantees of future results.
Moomoo is a financial information and trading app offered by Moomoo Technologies Inc. In the U.S., investment products and services on Moomoo are offered by Moomoo Financial Inc., Member FINRA/SIPC.
TradingView is an independent third party not affiliated with Moomoo Financial Inc., Moomoo Technologies Inc., or its affiliates. Moomoo Financial Inc. and its affiliates do not endorse, represent or warrant the completeness and accuracy of the data and information available on the TradingView platform and are not responsible for any services provided by the third-party platform.
Clause de non-responsabilité
Les informations et les publications ne sont pas destinées à être, et ne constituent pas, des conseils ou des recommandations en matière de finance, d'investissement, de trading ou d'autres types de conseils fournis ou approuvés par TradingView. Pour en savoir plus, consultez les Conditions d'utilisation.