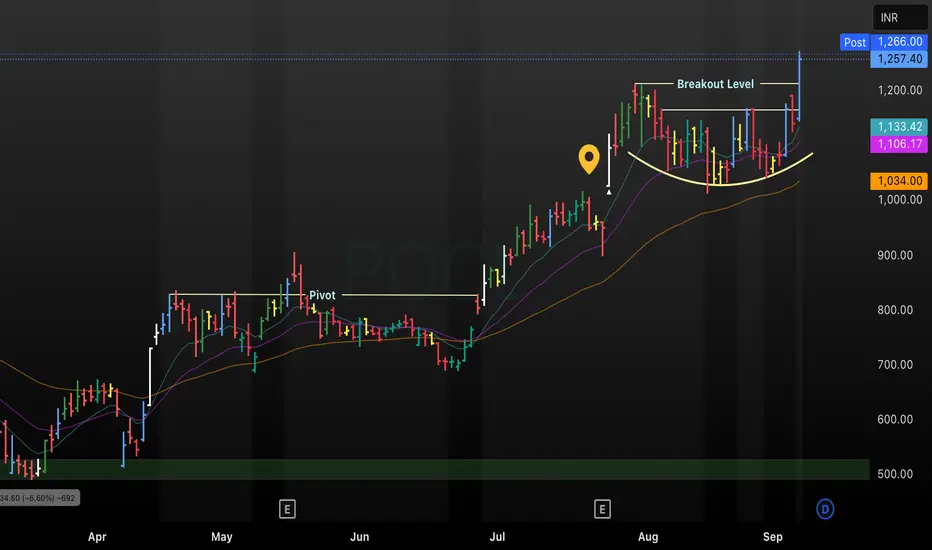
This annotated POCL daily chart tracks price movement from April to September 2025, displaying key technical events including a consolidation pivot, formation of a rounded base, and recent breakout above a major resistance level. Multiple moving averages (including short, medium, and long-term) support bullish momentum, with price closing above the breakout level and confirming a new uptrend. The setup provides trade entry signals and evidence of strengthening market structure for POCL as of September 20
Clause de non-responsabilité
Les informations et publications ne sont pas destinées à être, et ne constituent pas, des conseils ou recommandations financiers, d'investissement, de trading ou autres fournis ou approuvés par TradingView. Pour en savoir plus, consultez les Conditions d'utilisation.
Clause de non-responsabilité
Les informations et publications ne sont pas destinées à être, et ne constituent pas, des conseils ou recommandations financiers, d'investissement, de trading ou autres fournis ou approuvés par TradingView. Pour en savoir plus, consultez les Conditions d'utilisation.