Can Bulls Reclaim $70? 🚀
📆 Daily Chart — Macro Structure and Bias
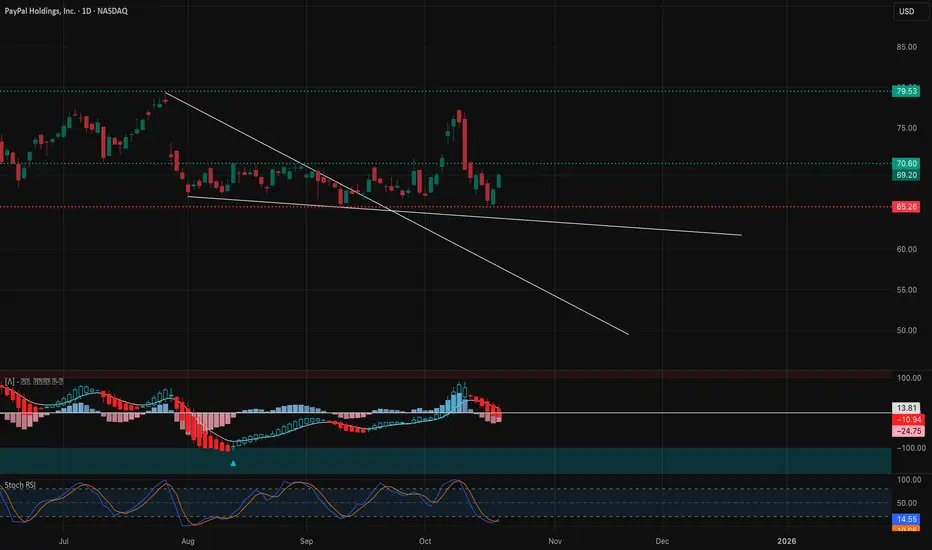
Market Structure: PayPal (PYPL) continues to trade within a broad descending channel but is showing early signs of structural stabilization. After several failed breakdowns, bulls defended the $64.50–$65.00 demand zone — a key level where prior liquidity sweeps triggered reversals. The most recent BOS (Break of Structure) around $69.00 indicates that smart money might be accumulating again within this base range.
We can see multiple CHoCH and BOS interactions suggesting buyers are quietly absorbing supply below $70, preparing for a potential structural shift back toward the mid-channel zone.
Supply & Demand / Order Blocks:
* Major Demand Zone: $64.00–$65.00 (deep OB and liquidity defense).
* Intermediate Supply Zone: $70.50–$71.00 (mid-channel resistance).
* Major Supply Zone: $79.00–$80.00 (top of the previous swing high cluster).
If bulls can maintain daily closes above $68.50, this could evolve into a mid-term reversal attempt toward $75+.
Indicator Confluence:
* 9 EMA vs 21 EMA: Bearish on macro view but flattening — momentum loss from sellers.
* MACD: Histogram is improving from deep negative; a cross above zero could confirm a macro shift.
* Stoch RSI: Rising sharply from oversold (10 → 45), signaling renewed buying strength.
* Volume: Buyer volume expanding near the base, consistent with accumulation phase behavior.
The daily structure remains in a potential bottoming phase; sustained closes above $69.50 will confirm a bullish shift.
⏱️ 1-Hour Chart — Short-Term Trend and Swing Bias

Market Structure: The 1-hour timeframe paints a much clearer bullish microstructure after a decisive CHoCH from the descending wedge. Price reclaimed $67.00, then printed a BOS toward $69.20, completing the first leg of reversal structure.
We’re now consolidating just beneath $69.80–$70.00, which lines up with the mid-term supply zone and a key call wall on the GEX chart. The structure remains bullish as long as $68.00 holds as a higher low.
Supply & Demand / OB Zones:
* Demand Zone: $67.00–$68.00 (recent breakout OB).
* Supply Zone: $69.80–$70.50 (local resistance and liquidity pocket).
Indicator Confluence:
* 9 EMA > 21 EMA — clear bullish alignment, steep slope.
* MACD: Strong expansion with rising histogram, supporting upward bias.
* Stoch RSI: Hovering at 80+ — slightly overheated, but not reversing yet.
* Volume: Increasing on breakouts, declining during pullbacks — healthy pattern.
Trade Scenarios:
* Bullish Setup: Buy dips near $68.20–$68.50 → Target $70.00 / $71.00 → Stop $67.20.
* Bearish Setup: If rejection from $70.50 with divergence → Short to $68.00 / $67.00 → Stop $71.00.
If PYPL breaks and closes above $70, it will invalidate short setups and start targeting $72.50–$73.50 next.
🕒 15-Minute Chart — Intraday Momentum and Scalping Zones

Market Structure: The 15-minute chart confirms strong short-term bullish control with stacked BOS and higher-low formations. Price is trending neatly along the rising intraday trendline, using the 9 EMA as dynamic support. Each micro pullback toward $68.80–$69.00 has been aggressively defended.
Supply & Demand / OB Levels:
* Demand Zone: $68.60–$68.80 (scalp OB and trendline support).
* Supply Zone: $69.80–$70.20 (intraday resistance + liquidity sweep potential).
Indicator Confluence:
* 9 EMA vs 21 EMA: Strong bullish slope; 9 EMA acting as perfect bounce line.
* MACD: Histogram slightly flattening after expansion — possible short-term cool-off.
* Stoch RSI: Overbought (>80), indicating potential short-term pause before continuation.
Scalp Plan:
* Bullish Bias: Enter near $68.80 pullback → Target $69.80 / $70.20 → Stop below $68.20.
* Bearish Bias: If $70 rejects twice with fading MACD momentum → Short scalp to $68.80 → Stop $70.40.
Intraday bias stays bullish unless price closes below $68.50 — that would mark short-term exhaustion.
📊 GEX (Gamma Exposure) & Options Sentiment Overview

PYPL’s options structure shows a neutral-to-bullish gamma setup with dealers likely positioned to stabilize price between $66–$70. The highest positive NET GEX sits around $70, effectively pinning current price in a tight gamma range.
Key GEX Levels:
* Highest Positive Gamma: $70.00 (dealer magnet).
* Major Call Walls: $72.00 and $74.00 — resistance zones if momentum expands.
* Put Support: $65.00 and $64.00 — strong floor if pullback occurs.
* IVR: 58.6 — elevated but not extreme, indicating active trader participation.
* Call Flow: 35.2% (muted but rising), suggesting cautious optimism.
If price sustains above $70.00, dealer hedging could flip to positive gamma expansion, pressing for a gradual melt-up toward $73–$74. A rejection below $68.00, however, might trigger delta-neutral unwind and short-term reversion to $65.
🎯 Closing Outlook
PYPL enters the week with a constructive recovery tone. The broader daily structure suggests a possible bottoming phase, while the intraday trend shows active buyer defense near $68. The GEX map supports a magnetized range between $68–$70, with potential gamma breakout if momentum persists midweek.
I’m watching for a decisive daily close above $70 — if bulls manage that, $72.50–$74 could be in play before the week ends. Below $68, expect a controlled retest toward $65 before another attempt higher.
Disclaimer: This analysis is for educational purposes only and not financial advice. Always do your own research and manage your risk.
📆 Daily Chart — Macro Structure and Bias
Market Structure: PayPal (PYPL) continues to trade within a broad descending channel but is showing early signs of structural stabilization. After several failed breakdowns, bulls defended the $64.50–$65.00 demand zone — a key level where prior liquidity sweeps triggered reversals. The most recent BOS (Break of Structure) around $69.00 indicates that smart money might be accumulating again within this base range.
We can see multiple CHoCH and BOS interactions suggesting buyers are quietly absorbing supply below $70, preparing for a potential structural shift back toward the mid-channel zone.
Supply & Demand / Order Blocks:
* Major Demand Zone: $64.00–$65.00 (deep OB and liquidity defense).
* Intermediate Supply Zone: $70.50–$71.00 (mid-channel resistance).
* Major Supply Zone: $79.00–$80.00 (top of the previous swing high cluster).
If bulls can maintain daily closes above $68.50, this could evolve into a mid-term reversal attempt toward $75+.
Indicator Confluence:
* 9 EMA vs 21 EMA: Bearish on macro view but flattening — momentum loss from sellers.
* MACD: Histogram is improving from deep negative; a cross above zero could confirm a macro shift.
* Stoch RSI: Rising sharply from oversold (10 → 45), signaling renewed buying strength.
* Volume: Buyer volume expanding near the base, consistent with accumulation phase behavior.
The daily structure remains in a potential bottoming phase; sustained closes above $69.50 will confirm a bullish shift.
⏱️ 1-Hour Chart — Short-Term Trend and Swing Bias
Market Structure: The 1-hour timeframe paints a much clearer bullish microstructure after a decisive CHoCH from the descending wedge. Price reclaimed $67.00, then printed a BOS toward $69.20, completing the first leg of reversal structure.
We’re now consolidating just beneath $69.80–$70.00, which lines up with the mid-term supply zone and a key call wall on the GEX chart. The structure remains bullish as long as $68.00 holds as a higher low.
Supply & Demand / OB Zones:
* Demand Zone: $67.00–$68.00 (recent breakout OB).
* Supply Zone: $69.80–$70.50 (local resistance and liquidity pocket).
Indicator Confluence:
* 9 EMA > 21 EMA — clear bullish alignment, steep slope.
* MACD: Strong expansion with rising histogram, supporting upward bias.
* Stoch RSI: Hovering at 80+ — slightly overheated, but not reversing yet.
* Volume: Increasing on breakouts, declining during pullbacks — healthy pattern.
Trade Scenarios:
* Bullish Setup: Buy dips near $68.20–$68.50 → Target $70.00 / $71.00 → Stop $67.20.
* Bearish Setup: If rejection from $70.50 with divergence → Short to $68.00 / $67.00 → Stop $71.00.
If PYPL breaks and closes above $70, it will invalidate short setups and start targeting $72.50–$73.50 next.
🕒 15-Minute Chart — Intraday Momentum and Scalping Zones
Market Structure: The 15-minute chart confirms strong short-term bullish control with stacked BOS and higher-low formations. Price is trending neatly along the rising intraday trendline, using the 9 EMA as dynamic support. Each micro pullback toward $68.80–$69.00 has been aggressively defended.
Supply & Demand / OB Levels:
* Demand Zone: $68.60–$68.80 (scalp OB and trendline support).
* Supply Zone: $69.80–$70.20 (intraday resistance + liquidity sweep potential).
Indicator Confluence:
* 9 EMA vs 21 EMA: Strong bullish slope; 9 EMA acting as perfect bounce line.
* MACD: Histogram slightly flattening after expansion — possible short-term cool-off.
* Stoch RSI: Overbought (>80), indicating potential short-term pause before continuation.
Scalp Plan:
* Bullish Bias: Enter near $68.80 pullback → Target $69.80 / $70.20 → Stop below $68.20.
* Bearish Bias: If $70 rejects twice with fading MACD momentum → Short scalp to $68.80 → Stop $70.40.
Intraday bias stays bullish unless price closes below $68.50 — that would mark short-term exhaustion.
📊 GEX (Gamma Exposure) & Options Sentiment Overview
PYPL’s options structure shows a neutral-to-bullish gamma setup with dealers likely positioned to stabilize price between $66–$70. The highest positive NET GEX sits around $70, effectively pinning current price in a tight gamma range.
Key GEX Levels:
* Highest Positive Gamma: $70.00 (dealer magnet).
* Major Call Walls: $72.00 and $74.00 — resistance zones if momentum expands.
* Put Support: $65.00 and $64.00 — strong floor if pullback occurs.
* IVR: 58.6 — elevated but not extreme, indicating active trader participation.
* Call Flow: 35.2% (muted but rising), suggesting cautious optimism.
If price sustains above $70.00, dealer hedging could flip to positive gamma expansion, pressing for a gradual melt-up toward $73–$74. A rejection below $68.00, however, might trigger delta-neutral unwind and short-term reversion to $65.
🎯 Closing Outlook
PYPL enters the week with a constructive recovery tone. The broader daily structure suggests a possible bottoming phase, while the intraday trend shows active buyer defense near $68. The GEX map supports a magnetized range between $68–$70, with potential gamma breakout if momentum persists midweek.
I’m watching for a decisive daily close above $70 — if bulls manage that, $72.50–$74 could be in play before the week ends. Below $68, expect a controlled retest toward $65 before another attempt higher.
Disclaimer: This analysis is for educational purposes only and not financial advice. Always do your own research and manage your risk.
Transaction en cours
Mid Day Session Update — Oct 21PYPL is holding strong above $70, riding the trendline cleanly after a solid BOS breakout this morning. Momentum cooled off slightly after tagging $70.60, but overall structure still leans bullish.
➡️ Support: 69.80 → 69.20
➡️ Resistance: 70.60 → 71.00
MACD showing a minor fade but still above zero — healthy pullback vibes, not full reversal yet.
As long as PYPL stays above $69.80, bulls are in control. Watch for another push toward $71+ if buyers defend the trendline.
Trade fermée: cible de profit atteinte
Intraday Update (Oct 24)Price is attempting to stabilize after a sharp morning pullback from the BOS region near $71.5. Buyers stepped in around the $69.7–$70 demand zone, defending the structure for now and forming a short-term base.
* Current Price: $70.47
* Structure: Still within a rising channel but showing signs of a temporary retracement phase.
* CHoCH Zone: Around $69.8 — remains the key support to maintain bullish bias.
* BOS Confirmation: The previous Break of Structure near $71.2–$71.5** defines the upper boundary for potential rebound targets.
* MACD: Starting to shift back toward the zero line, showing early signs of bullish momentum recovery after a cooling phase.
* Stochastic RSI: Rising from the oversold zone — could fuel a short-term bounce if momentum continues to build.
Key Levels to Watch
* Immediate Resistance: $71.20 → $71.50
* Support Zone: $69.70 → $69.30
* Breakdown Risk: A move below $69.3 may invalidate the structure and test $68.8–$68.5 liquidity area.
The structure is still constructive within the rising channel, but momentum remains fragile. If $69.7 holds, expect a push back toward $71.2–$71.5 to retest the prior BOS level. However, a failure to hold above $70 could lead to a retest of the lower demand block near $69.3 before any further upside attempt.
Clause de non-responsabilité
Les informations et publications ne sont pas destinées à être, et ne constituent pas, des conseils ou recommandations financiers, d'investissement, de trading ou autres fournis ou approuvés par TradingView. Pour en savoir plus, consultez les Conditions d'utilisation.
Clause de non-responsabilité
Les informations et publications ne sont pas destinées à être, et ne constituent pas, des conseils ou recommandations financiers, d'investissement, de trading ou autres fournis ou approuvés par TradingView. Pour en savoir plus, consultez les Conditions d'utilisation.