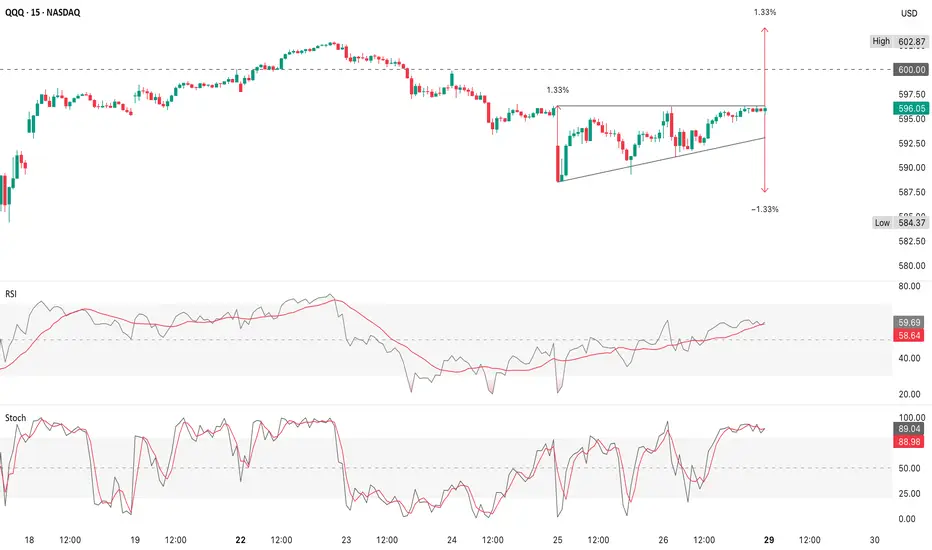
The 15m intraday chart suggests a rising wedge/ascending triangle forming under $597–$598 resistance
QQQ is in a well-established uptrend
QQQ is pressing right under the $602–$609 resistance
The key watch is does QQQ consolidate and push through $609, or does it fail and retest $586–$590 support?
QQQ is in a strong uptrend, but this week hinges on the $602–$609 resistance
- The measured move shown is about ±1.33% from the breakout
- That puts upside potential near $603 (recent high) or downside risk toward $584–$585
- RSI is around 59 - climbing, but not overbought yet
- Stochastic is very elevated (~89), which often signals short-term exhaustion
- A break above $598–$600 could retest highs at $602–$603
- A rejection here could unwind back to $590 or lower support ($584–$586)
QQQ is in a well-established uptrend
- Price has respected moving averages & envelopes for months, with pullbacks shallow (~4–5%) & quickly bought
QQQ is pressing right under the $602–$609 resistance
- A weekly close above ~$609 would confirm continuation, with no major overhead resistance
- A stall here could lead to mean reversion toward the 20d MA (~$586) or even the 20 MA if sellers press harder
- The character of pullbacks (quick, shallow, bought up) favors continuation unless a sharp catalyst breaks the pattern
The key watch is does QQQ consolidate and push through $609, or does it fail and retest $586–$590 support?
- The primary trend is up (bulls in control)
- $602–$609 = breakout = continuation, rejection = mean reversion to $586–$590
- No technical damage unless QQQ breaks below ~$572
QQQ is in a strong uptrend, but this week hinges on the $602–$609 resistance
- A breakout = trend extension
- A rejection = routine pullback to support
I am not a licensed professional & these posts are for informational purposes only, not financial advice
Clause de non-responsabilité
Les informations et publications ne sont pas destinées à être, et ne constituent pas, des conseils ou recommandations financiers, d'investissement, de trading ou autres fournis ou approuvés par TradingView. Pour en savoir plus, consultez les Conditions d'utilisation.