After a month building my automated pattern detection system (Legend AI) and preparing for CMT Level I, I returned to find one of the cleanest technical setups of 2025—and today it's showing early signs of confirmation.
━━━━━━━━━━━━━━━━━━━━━━━━
THE SETUP: BEARISH DIVERGENCE NEAR ALL-TIME HIGHS
Recent Action:
As of today's close:
━━━━━━━━━━━━━━━━━━━━━━━━
PART 1: THE DIVERGENCE (SPY/QQQ)
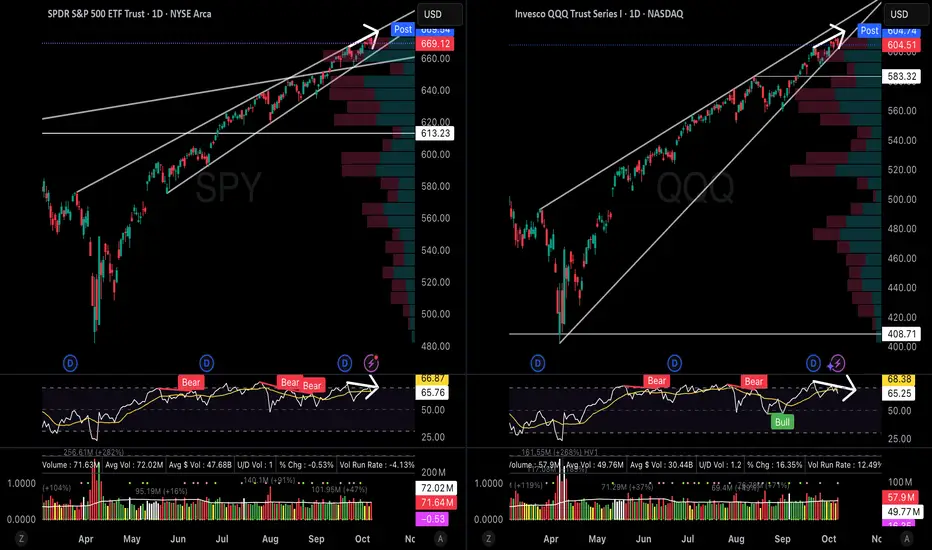
 SPY and QQQ daily charts showing price near highs while RSI makes lower highs, volume below average
SPY Analysis:
Price Structure:
RSI (14-period):
Textbook negative divergence.
Price making higher highs. RSI making lower highs. When momentum diverges from price, rallies often exhaust.
Volume (Critical Signal):
When institutions are excited, volume SURGES. When they're distributing, volume DRIES UP.
Current pattern suggests distribution.
QQQ Analysis:
Price Structure:
RSI Divergence:
Volume:
Less extreme than SPY, but weekly RSI shows clear decline from August highs.
━━━━━━━━━━━━━━━━━━━━━━━━
PART 2: SECTOR ROTATION (The Tell)
 XLK extended at resistance, XLV breaking higher showing defensive rotation
XLK (Technology): ~$286
XLV (Healthcare): ~$144
What This Rotation Signals:
When money flows to defensives DURING a bull market, institutions are often de-risking.
The cycle:
XLV strength while XLK stalls = classic late-cycle behavior.
━━━━━━━━━━━━━━━━━━━━━━━━
PART 3: VIX COMPRESSION (The Spring)
 VIX in 5-month descending triangle around 17, compression before expansion
VIX: Around 17 (up ~6% today)
Structure: 5-month descending triangle
Why This Matters:
VIX compression at market highs is often complacency, not confidence.
Historical Context:
Today's surge is the first significant move in months.
Breakout Level: 21
VIX close above 21 would break descending triangle (bullish for VIX = bearish for equities).
Typical spike from these patterns: 30-50% within 2 weeks.
━━━━━━━━━━━━━━━━━━━━━━━━
WHY I'M BUILDING LEGEND AI
This is EXACTLY the pattern I'm building Legend AI to detect automatically.
The system I'm developing scans for:
Why Automation Matters:
I identified this setup manually by:
This took 2-3 hours of focused analysis.
The Challenge: Doesn't scale. Limited tickers, timeframes, and signals I can monitor.
The Solution: Automate pattern detection to scan 500+ stocks in seconds, flag divergences on multiple timeframes, calculate volume deviations automatically, and alert high-probability setups.
The Result: Focus shifts from hunting patterns to executing trades.
This is institutional-grade approach—building systems that identify edge systematically, removing emotion and scaling analysis.
Current Development Status:
This divergence setup proves the concept: I can identify these patterns manually through disciplined analysis. Now building tools to systematize the process at scale.
━━━━━━━━━━━━━━━━━━━━━━━━
TODAY'S EARLY CONFIRMATION
As of today's close:
Indices:
Key Observations:
This represents early-stage confirmation.
Not full breakdown yet, but thesis developing:
━━━━━━━━━━━━━━━━━━━━━━━━
CONFIRMATION CHECKLIST
Not calling a top. Identifying elevated risk.
Watching For Full Confirmation:
1. Price Breakdown
2. Volume Confirmation
3. VIX Breakout
4. Sector Confirmation
Current Approach:
Respecting the uptrend. Not shorting yet.
But adjusting:
Risk management, not market timing.
━━━━━━━━━━━━━━━━━━━━━━━━
RISK FRAMEWORK
GREEN LIGHT (Lower Risk):
Action: Normal size, wider stops
YELLOW LIGHT (Elevated Risk): ← CURRENT STATUS
Action: Reduce 30-40%, tighten stops, favor quality
RED LIGHT (High Risk):
Action: Minimal exposure, preservation mode
━━━━━━━━━━━━━━━━━━━━━━━━
ALTERNATIVE SCENARIOS
Comprehensive analysis considers multiple outcomes.
Bullish Case (What Could Invalidate):
If these occur, divergence might resolve through consolidation (sideways digestion 4-8 weeks) rather than correction (breakdown).
Never marry a thesis. Follow the data as it develops.
━━━━━━━━━━━━━━━━━━━━━━━━
SUMMARY
After a month of building and studying, returned to find a textbook setup showing early confirmation.
The Evidence:
This suggests elevated risk, not guaranteed correction.
Approach:
Best traders prepare for multiple outcomes rather than predicting one.
━━━━━━━━━━━━━━━━━━━━━━━━
What are you seeing in current market structure? Comment below—I engage with all responses.
If this analysis added value, boost it so others can benefit.
Follow for more systematic technical analysis and Legend AI development updates.
—Kyle Thomas
CMT Level I Candidate | SIE Certified
Building Legend AI: Automated pattern detection for systematic trading
━━━━━━━━━━━━━━━━━━━━━━━━
THE SETUP: BEARISH DIVERGENCE NEAR ALL-TIME HIGHS
Recent Action:
- SPY approached $669 (ATH territory)
- QQQ approached $605 (ATH territory)
- Markets at elevated levels
As of today's close:
- Both indices slightly red on light volume
- VIX up approximately 6% (waking from compression)
- Early confirmation of divergence thesis
━━━━━━━━━━━━━━━━━━━━━━━━
PART 1: THE DIVERGENCE (SPY/QQQ)
SPY Analysis:
Price Structure:
- Near all-time highs around $669
- Ascending channel (upper resistance)
- Above all major moving averages
RSI (14-period):
- August peak: 72
- September peak: 68
- October peak: 65
Textbook negative divergence.
Price making higher highs. RSI making lower highs. When momentum diverges from price, rallies often exhaust.
Volume (Critical Signal):
- Recent volume: 20-30% below 20-day average
- Distribution pattern emerging
When institutions are excited, volume SURGES. When they're distributing, volume DRIES UP.
Current pattern suggests distribution.
QQQ Analysis:
Price Structure:
- Near highs around $605
- Channel resistance test
- Tech still leading (but showing fatigue)
RSI Divergence:
- September: 70
- October: 65
Volume:
- Approximately 5-10% below average
Less extreme than SPY, but weekly RSI shows clear decline from August highs.
━━━━━━━━━━━━━━━━━━━━━━━━
PART 2: SECTOR ROTATION (The Tell)
XLK (Technology): ~$286
- At upper channel resistance (third touch)
- RSI showing fatigue
- Volume below average
XLV (Healthcare): ~$144
- Breaking out of downtrend
- RSI improving (mid-50s range)
- Defensive bid emerging
What This Rotation Signals:
When money flows to defensives DURING a bull market, institutions are often de-risking.
The cycle:
- Tech/Growth leads (early bull)
- Cyclicals lead (mid bull)
- Defensives lead (late bull) ← Current phase
- Cash/Bonds lead (bear market) ← Potential next
XLV strength while XLK stalls = classic late-cycle behavior.
━━━━━━━━━━━━━━━━━━━━━━━━
PART 3: VIX COMPRESSION (The Spring)
VIX: Around 17 (up ~6% today)
Structure: 5-month descending triangle
- Lower highs: 22 → 20 → 18
- Flat support: 15
- Apex approaching
Why This Matters:
VIX compression at market highs is often complacency, not confidence.
Historical Context:
- January 2022: VIX 17 → spiked to 37 (market corrected 12%)
- August 2024: VIX 15 → spiked to 65 (flash crash 10%)
- February 2020: VIX 14 → spiked to 85 (COVID crash 35%)
Today's surge is the first significant move in months.
Breakout Level: 21
VIX close above 21 would break descending triangle (bullish for VIX = bearish for equities).
Typical spike from these patterns: 30-50% within 2 weeks.
━━━━━━━━━━━━━━━━━━━━━━━━
WHY I'M BUILDING LEGEND AI
This is EXACTLY the pattern I'm building Legend AI to detect automatically.
The system I'm developing scans for:
- Multi-timeframe RSI divergence (daily + weekly)
- Volume anomalies (significantly below average on strength)
- Sector rotation shifts (defensive vs growth)
- VIX compression extremes
- Risk/reward scoring
Why Automation Matters:
I identified this setup manually by:
- Scanning charts for divergence patterns
- Calculating volume deviations vs moving averages
- Tracking sector ETF rotation
- Monitoring VIX structure
- Synthesizing signals into risk assessment
This took 2-3 hours of focused analysis.
The Challenge: Doesn't scale. Limited tickers, timeframes, and signals I can monitor.
The Solution: Automate pattern detection to scan 500+ stocks in seconds, flag divergences on multiple timeframes, calculate volume deviations automatically, and alert high-probability setups.
The Result: Focus shifts from hunting patterns to executing trades.
This is institutional-grade approach—building systems that identify edge systematically, removing emotion and scaling analysis.
Current Development Status:
- Foundation: Built
- VCP pattern detection: In progress (~60% complete)
- Divergence detection: In development (~30% complete)
- Target: End of October for initial version
This divergence setup proves the concept: I can identify these patterns manually through disciplined analysis. Now building tools to systematize the process at scale.
━━━━━━━━━━━━━━━━━━━━━━━━
TODAY'S EARLY CONFIRMATION
As of today's close:
Indices:
- SPY/QQQ: Slightly negative on light volume
- Dow: Minor weakness
Key Observations:
- Volume remained below average into close
- Tech showed slight underperformance
- VIX up approximately 6% (stirring from slumber)
- Defensive sectors maintained relative strength
This represents early-stage confirmation.
Not full breakdown yet, but thesis developing:
- Distribution continues (persistent light volume)
- Defensives outperforming (rotation in progress)
- Volatility awakening (VIX responding)
━━━━━━━━━━━━━━━━━━━━━━━━
CONFIRMATION CHECKLIST
Not calling a top. Identifying elevated risk.
Watching For Full Confirmation:
1. Price Breakdown
- SPY closes decisively below $650
- QQQ closes below $583 (50-day MA)
- Preferably same day
2. Volume Confirmation
- SPY volume significantly above average on breakdown
- QQQ volume surge on weakness
- Proves institutional selling
3. VIX Breakout
- VIX closes above 21
- With participation
- Confirms fear entering
4. Sector Confirmation
- XLV outperforms XLK by 2%+ over multiple days
- Defensive rotation accelerates clearly
Current Approach:
Respecting the uptrend. Not shorting yet.
But adjusting:
- Reducing position size 30-40%
- Tightening stops to 2-3% max
- Avoiding aggressive longs at resistance
- Building watchlist for post-correction opportunities
Risk management, not market timing.
━━━━━━━━━━━━━━━━━━━━━━━━
RISK FRAMEWORK
GREEN LIGHT (Lower Risk):
- Price + momentum confirming
- Volume strong on breakouts
- VIX contained and declining
- Clear sector leadership
Action: Normal size, wider stops
YELLOW LIGHT (Elevated Risk): ← CURRENT STATUS
- Divergence present but not fully confirmed
- Volume declining
- VIX compressed but not breaking
- Sector rotation beginning
Action: Reduce 30-40%, tighten stops, favor quality
RED LIGHT (High Risk):
- Confirmed breakdown with volume
- VIX spiking above 25
- Defensives significantly outperforming
Action: Minimal exposure, preservation mode
━━━━━━━━━━━━━━━━━━━━━━━━
ALTERNATIVE SCENARIOS
Comprehensive analysis considers multiple outcomes.
Bullish Case (What Could Invalidate):
- Volume Returns: New highs with strong participation
- Earnings Exceed: Q3 significantly beats expectations
- Fed Support: Rate cut signals come sooner
- Breadth Improves: Small caps participate, A/D confirms
If these occur, divergence might resolve through consolidation (sideways digestion 4-8 weeks) rather than correction (breakdown).
Never marry a thesis. Follow the data as it develops.
━━━━━━━━━━━━━━━━━━━━━━━━
SUMMARY
After a month of building and studying, returned to find a textbook setup showing early confirmation.
The Evidence:
- Bearish divergence (SPY, QQQ)
- Distribution pattern (light volume into strength)
- VIX compression ending (surge today)
- Sector rotation to defensives (XLV strength)
- Early validation (today's weak close)
This suggests elevated risk, not guaranteed correction.
Approach:
- Reduce exposure meaningfully
- Tighten risk management
- Watch for full confirmation
- Stay disciplined and patient
Best traders prepare for multiple outcomes rather than predicting one.
━━━━━━━━━━━━━━━━━━━━━━━━
What are you seeing in current market structure? Comment below—I engage with all responses.
If this analysis added value, boost it so others can benefit.
Follow for more systematic technical analysis and Legend AI development updates.
—Kyle Thomas
CMT Level I Candidate | SIE Certified
Building Legend AI: Automated pattern detection for systematic trading
Clause de non-responsabilité
Les informations et publications ne sont pas destinées à être, et ne constituent pas, des conseils ou recommandations financiers, d'investissement, de trading ou autres fournis ou approuvés par TradingView. Pour en savoir plus, consultez les Conditions d'utilisation.
Clause de non-responsabilité
Les informations et publications ne sont pas destinées à être, et ne constituent pas, des conseils ou recommandations financiers, d'investissement, de trading ou autres fournis ou approuvés par TradingView. Pour en savoir plus, consultez les Conditions d'utilisation.