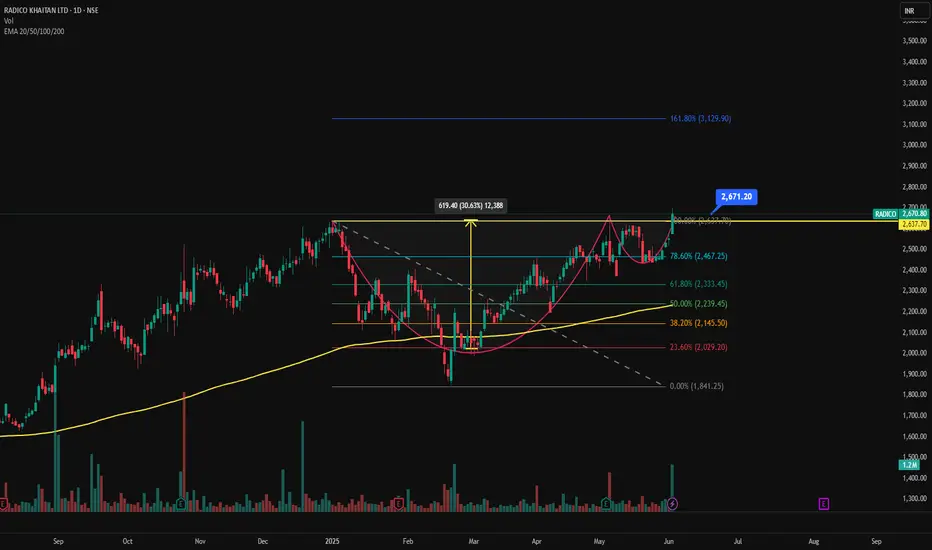
📊 RADICO KHAITAN LTD (RADICO) – Cup & Handle Breakout | Daily Chart
📅 Chart Date: June 4, 2025
📈 CMP: ₹2,670.80 (+4.78%)
📍 Ticker: NSE:RADICO
🔍 Technical Breakdown
☕ Cup & Handle Breakout Confirmed
A classic Cup & Handle formation has played out with a bullish breakout above the neckline near ₹2,640–₹2,670. The pattern is well-structured, showing clear accumulation followed by a rounded bottom and brief consolidation.
📏 Measured Target:
The height of the cup (~₹620) projects an initial target near ₹3,129, aligning closely with the 161.80% Fibonacci Extension level.
⚙️ Indicators Used
🔹 Chart Pattern: Cup & Handle
📐 Fibonacci Retracement & Extension
📊 Volume Spike: Strong breakout volume
📈 EMA Cluster: 20/50/100/200-day — bullish alignment
🟢 EMA Support: Price sustaining well above EMAs; 200 EMA ~₹2,000
📍 Key Price Levels
✅ Breakout Zone: ₹2,640–₹2,670
🚀 Upside Targets:
📈 127.20% – ₹2,853
📈 161.80% – ₹3,129
📈 200% – ₹3,352 (extended swing target)
🛡️ Support Levels:
₹2,467 – 78.6% Fibo
₹2,333 – 61.8%
₹2,145 – 38.2%
₹2,029 – 23.6%
🔻 Invalidation/Stop: Closing below ₹2,467 (strong Fibo + EMA support zone)
💼 Trading Strategy
Entry: On breakout retest or strong close above ₹2,670
Stop Loss: ₹2,467
Target Range: ₹2,853 – ₹3,129 – ₹3,350+
Timeframe: Short to medium term swing
⚠️ Disclaimer
This analysis is for educational purposes only. Please do your own research or consult a financial advisor before making trading/investment decisions.
Clause de non-responsabilité
Les informations et publications ne sont pas destinées à être, et ne constituent pas, des conseils ou recommandations financiers, d'investissement, de trading ou autres fournis ou approuvés par TradingView. Pour en savoir plus, consultez les Conditions d'utilisation.
Clause de non-responsabilité
Les informations et publications ne sont pas destinées à être, et ne constituent pas, des conseils ou recommandations financiers, d'investissement, de trading ou autres fournis ou approuvés par TradingView. Pour en savoir plus, consultez les Conditions d'utilisation.