https://www.tradingview.com/x/xVJOxxVJ
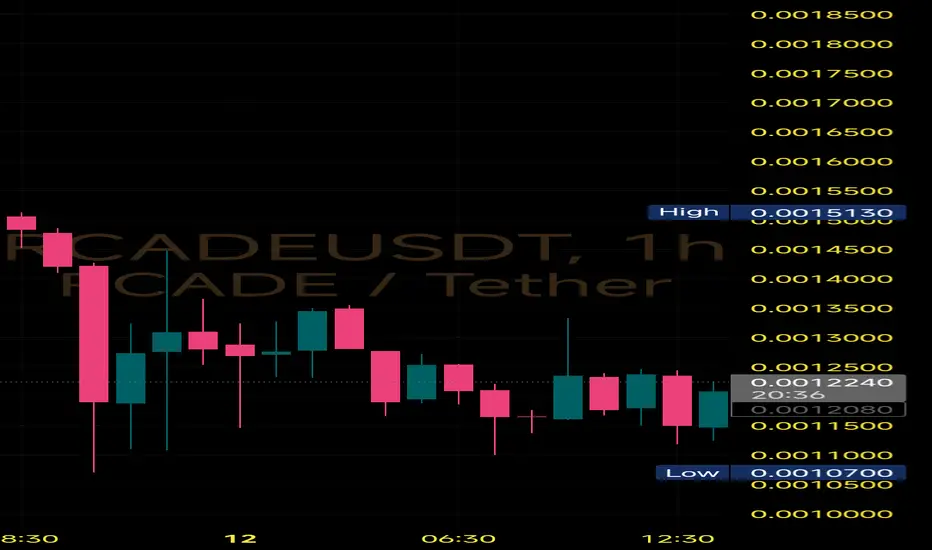
#RCADE is showing signs of a potential reversal on the 1Hr timeframe, forming a Double Bottom near the 0.00117 support zone.
🔹Bottom 1 and Bottom 2 are now clearly defined
🔹Neckline resistance at ~0.00145
🔹Current price hovering around 0.00122
Bullish only if -
A breakout and close above 0.00145 with volume = confirmation of reversal
Target zone = 0.00160–0.00170
Breakdown below 0.00117 would invalidate the double bottom setup
⏳ Price is compressing—watch for breakout attempts soon.
Clause de non-responsabilité
Les informations et les publications ne sont pas destinées à être, et ne constituent pas, des conseils ou des recommandations en matière de finance, d'investissement, de trading ou d'autres types de conseils fournis ou approuvés par TradingView. Pour en savoir plus, consultez les Conditions d'utilisation.