📈 Refex Industries Ltd – Weekly Breakout Trade Setup
Chart Structure:
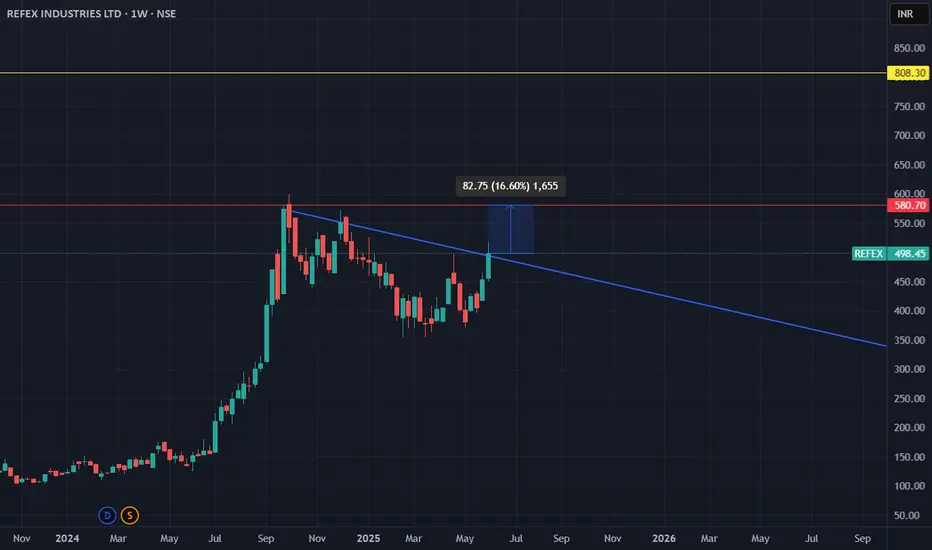
Refex has broken out of a long-term descending trendline on the weekly chart with strong bullish momentum. This move marks a potential trend reversal after months of consolidation and lower highs.
🔍 Technical Breakdown:
Trendline Breakout:
Price has convincingly closed above a multi-month descending trendline, indicating a potential shift in trend structure.
Volume Confirmation:
(Add volume insight if available) Ideally, a breakout accompanied by rising volume adds confidence in the move.
Resistance Levels:
Immediate resistance at ₹580.70 (marked by previous weekly top).
Next major target zone: ₹811.15 (historical high or measured move level).
Breakout Candle Stats:
Move: +82.75 pts from breakout (Approx. 16.6% upside)
Breakout level: Around ₹415–₹420
Current price: ₹498.45
🎯 Trade Plan:
Entry: On confirmed weekly close above ₹450 (already done)
Target 1: ₹580
Target 2: ₹810
Stop Loss: Weekly close below ₹410 (back inside the trendline)
📌 Trade Logic:
This setup is a classic descending trendline breakout following a prolonged consolidation. Once such major resistance is broken, momentum traders and swing traders often step in, driving the price toward the next resistance zones. The structure also hints at a rounded bottom formation, suggesting accumulation.
⚠️ Risk Note:
Watch for possible rejection near ₹580.
Avoid chasing if price moves too far too fast without pullback.
📅 Time Horizon: Medium term (4–12 weeks)
💡 Bias: Bullish until ₹410 is breached on a closing basis.
Chart Structure:
Refex has broken out of a long-term descending trendline on the weekly chart with strong bullish momentum. This move marks a potential trend reversal after months of consolidation and lower highs.
🔍 Technical Breakdown:
Trendline Breakout:
Price has convincingly closed above a multi-month descending trendline, indicating a potential shift in trend structure.
Volume Confirmation:
(Add volume insight if available) Ideally, a breakout accompanied by rising volume adds confidence in the move.
Resistance Levels:
Immediate resistance at ₹580.70 (marked by previous weekly top).
Next major target zone: ₹811.15 (historical high or measured move level).
Breakout Candle Stats:
Move: +82.75 pts from breakout (Approx. 16.6% upside)
Breakout level: Around ₹415–₹420
Current price: ₹498.45
🎯 Trade Plan:
Entry: On confirmed weekly close above ₹450 (already done)
Target 1: ₹580
Target 2: ₹810
Stop Loss: Weekly close below ₹410 (back inside the trendline)
📌 Trade Logic:
This setup is a classic descending trendline breakout following a prolonged consolidation. Once such major resistance is broken, momentum traders and swing traders often step in, driving the price toward the next resistance zones. The structure also hints at a rounded bottom formation, suggesting accumulation.
⚠️ Risk Note:
Watch for possible rejection near ₹580.
Avoid chasing if price moves too far too fast without pullback.
📅 Time Horizon: Medium term (4–12 weeks)
💡 Bias: Bullish until ₹410 is breached on a closing basis.
Clause de non-responsabilité
Les informations et les publications ne sont pas destinées à être, et ne constituent pas, des conseils ou des recommandations en matière de finance, d'investissement, de trading ou d'autres types de conseils fournis ou approuvés par TradingView. Pour en savoir plus, consultez les Conditions d'utilisation.