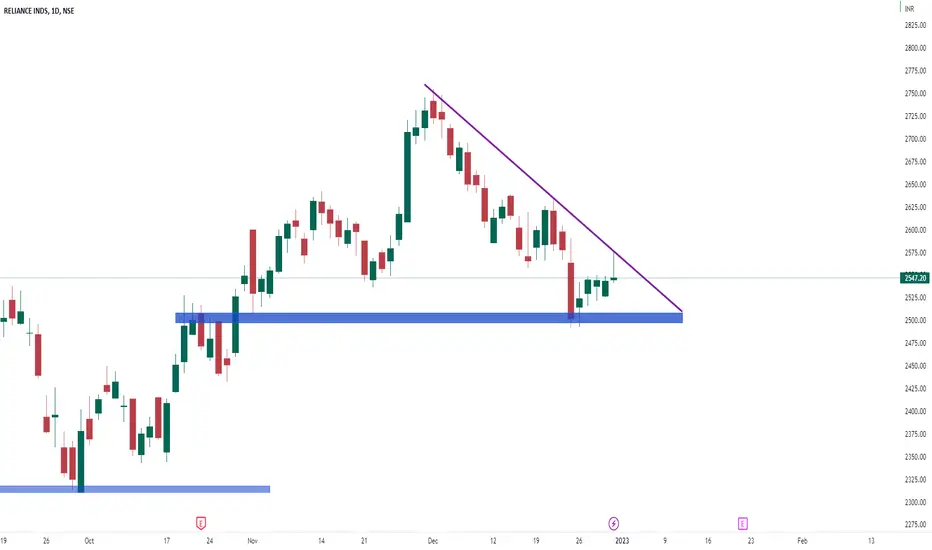
Day chart of reliance ind
it is making triangle pattern on daily chart in which important support zone is 2490 zone and Resistance is trendline
& today it is making inverse hammer candle which indicates bearish view for monday. On monday if this stocks breaks friday low then I will start shorting.
it is making triangle pattern on daily chart in which important support zone is 2490 zone and Resistance is trendline
& today it is making inverse hammer candle which indicates bearish view for monday. On monday if this stocks breaks friday low then I will start shorting.
Clause de non-responsabilité
Les informations et les publications ne sont pas destinées à être, et ne constituent pas, des conseils ou des recommandations en matière de finance, d'investissement, de trading ou d'autres types de conseils fournis ou approuvés par TradingView. Pour en savoir plus, consultez les Conditions d'utilisation.