📈 Current Price & Recent Performance
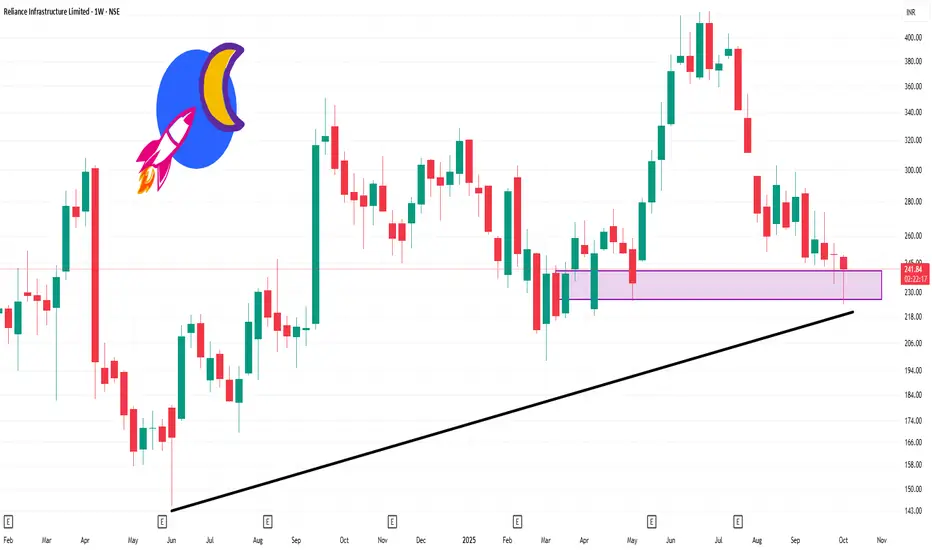
Current Price: ₹241.84 (as of October 10, 2025)
1-Week Change: +5.00%
52-Week Range: ₹198.13 – ₹423.40
🔍 Technical Indicators (Weekly Timeframe)
Relative Strength Index (RSI): Indicates a neutral condition, suggesting neither overbought nor oversold conditions.
Stochastic Oscillator: Shows a bullish condition, with readings between 55 and 80.
Rate of Change (ROC): Indicates a bearish condition, with readings below 0.
Commodity Channel Index (CCI): Shows a neutral condition, with readings between 45 and 55.
Money Flow Index (MFI): Indicates a neutral condition, with readings between 45 and 55.
Average True Range (ATR): Suggests a less volatile market, with values less than or equal to the 9-day Simple Moving Average (SMA).
Average Directional Index (ADX): Indicates a weak trend, with values below 20.
📊 Moving Averages & Trend Analysis
Short-Term Moving Averages: Currently below long-term averages, indicating a bearish trend.
Resistance Levels: Key resistance levels identified at ₹239.34 and ₹262.85.
Publications connexes
Clause de non-responsabilité
Les informations et publications ne sont pas destinées à être, et ne constituent pas, des conseils ou recommandations financiers, d'investissement, de trading ou autres fournis ou approuvés par TradingView. Pour en savoir plus, consultez les Conditions d'utilisation.