Key Intraday Data:
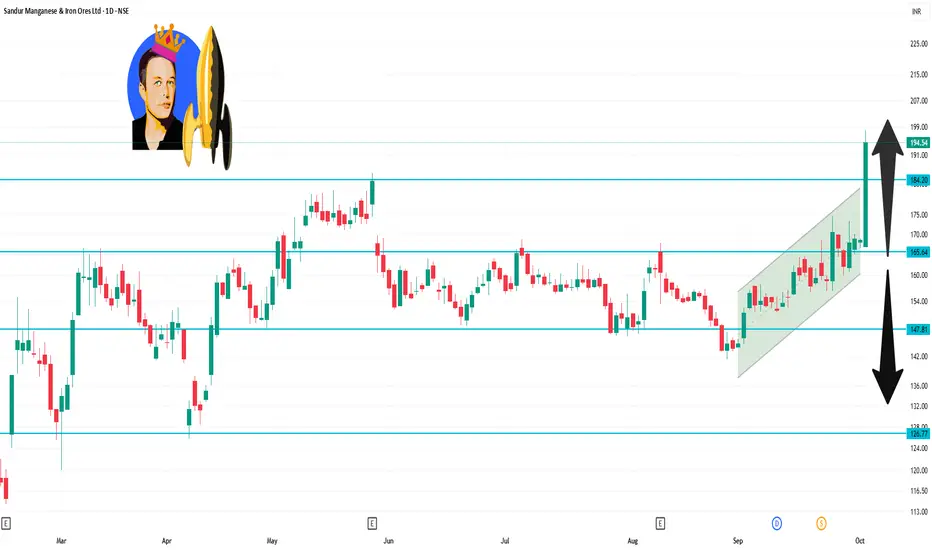
Opening Price: ₹167.00
Closing Price: ₹194.40
Day’s Range: ₹166.85 – ₹198.10
52-Week Range: ₹112.77 – ₹198.10
Volume Traded: Approximately 36.3 million shares
Market Capitalization: ₹9,457 crore
The stock closed at ₹194.40, marking a 15.34% increase from the previous close of ₹168.54. It also achieved a new 52-week high of ₹198.10 during the day.
Technical Indicators:
Technical analysis indicates a strong bullish trend for the stock. The Relative Strength Index (RSI) stands at 78.05, suggesting that the stock is approaching overbought territory.
Publications connexes
Clause de non-responsabilité
Les informations et les publications ne sont pas destinées à être, et ne constituent pas, des conseils ou des recommandations en matière de finance, d'investissement, de trading ou d'autres types de conseils fournis ou approuvés par TradingView. Pour en savoir plus, consultez les Conditions d'utilisation.