Perfect — let’s add the moving averages context to make the analysis sharper and more professional:
⸻
📊 SEDG | SolarEdge – Weekly Technical Analysis
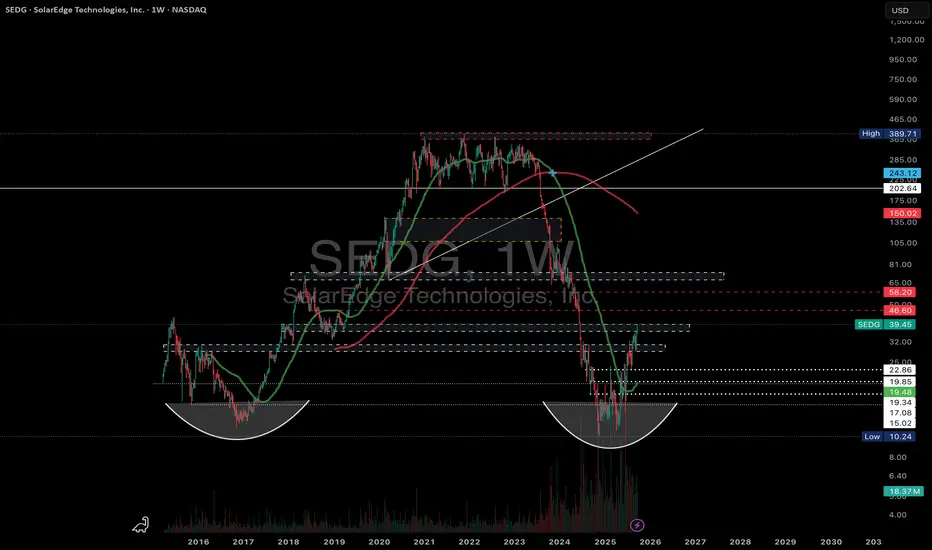
The current price of SolarEdge (SEDG) is $39.45 USD (+4.09%).
🔹 Key Supports:
• $22.86 – Recently confirmed support level.
• $19.85 / $19.34 – Historical support cluster.
• $15.02 – Strong long-term support.
• $10.24 – Multi-year low and critical floor.
🔸 Major Resistances:
• $46.60 – First near-term resistance; breakout here would confirm bullish momentum.
• $58.20 – Stronger resistance level above.
• $150.00 – Key mid-term target and psychological barrier.
• $202.64 → $243.12 → $389.71 – Long-term resistance zones if the broader trend reverses.
📈 Technical Outlook with Moving Averages:
• 50-week SMA (green line): Price is currently testing just below this moving average. A decisive breakout above would add conviction to the bullish case.
• 200-week SMA (red line): Still far above current levels (~$150). This remains a long-term resistance barrier that must be reclaimed before a true trend reversal can be confirmed.
• The wide gap between the 50W and 200W SMAs highlights the depth of the prior downtrend, but it also provides significant upside potential if accumulation continues.
✅ Conclusion (with Price + MAs):
At $39.45, SEDG is trading below the 50W SMA and well under the 200W SMA, signaling it’s still in a recovery phase after a major downtrend. Clearing $46.60 (near-term resistance + above 50W SMA) would be the first real technical confirmation of strength. Longer-term trend reversal signals will only arrive once the stock pushes toward and above the 200W SMA (~$150).
⸻
📊
The current price of SolarEdge (SEDG) is $39.45 USD (+4.09%).
🔹 Key Supports:
• $22.86 – Recently confirmed support level.
• $19.85 / $19.34 – Historical support cluster.
• $15.02 – Strong long-term support.
• $10.24 – Multi-year low and critical floor.
🔸 Major Resistances:
• $46.60 – First near-term resistance; breakout here would confirm bullish momentum.
• $58.20 – Stronger resistance level above.
• $150.00 – Key mid-term target and psychological barrier.
• $202.64 → $243.12 → $389.71 – Long-term resistance zones if the broader trend reverses.
📈 Technical Outlook with Moving Averages:
• 50-week SMA (green line): Price is currently testing just below this moving average. A decisive breakout above would add conviction to the bullish case.
• 200-week SMA (red line): Still far above current levels (~$150). This remains a long-term resistance barrier that must be reclaimed before a true trend reversal can be confirmed.
• The wide gap between the 50W and 200W SMAs highlights the depth of the prior downtrend, but it also provides significant upside potential if accumulation continues.
✅ Conclusion (with Price + MAs):
At $39.45, SEDG is trading below the 50W SMA and well under the 200W SMA, signaling it’s still in a recovery phase after a major downtrend. Clearing $46.60 (near-term resistance + above 50W SMA) would be the first real technical confirmation of strength. Longer-term trend reversal signals will only arrive once the stock pushes toward and above the 200W SMA (~$150).
Clause de non-responsabilité
Les informations et publications ne sont pas destinées à être, et ne constituent pas, des conseils ou recommandations financiers, d'investissement, de trading ou autres fournis ou approuvés par TradingView. Pour en savoir plus, consultez les Conditions d'utilisation.
Clause de non-responsabilité
Les informations et publications ne sont pas destinées à être, et ne constituent pas, des conseils ou recommandations financiers, d'investissement, de trading ou autres fournis ou approuvés par TradingView. Pour en savoir plus, consultez les Conditions d'utilisation.