---
### 📊 **Technical Summary:**
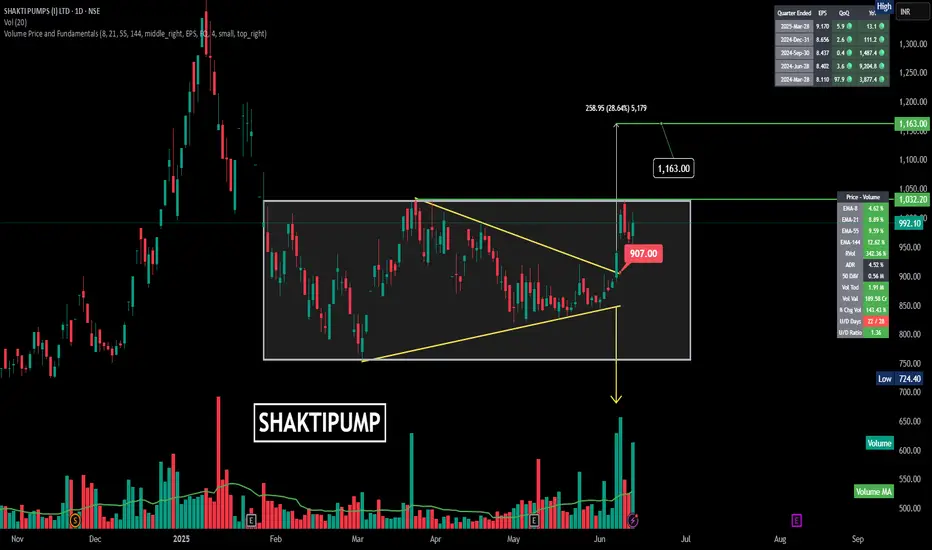
#### 🔹 **Chart Pattern:**
* A **falling wedge** breakout occurred **within a broader rectangular consolidation** (boxed range).
* The breakout zone was near **₹907**, and the stock has since surged past the key resistance.
#### 🔹 **Breakout Confirmation:**
* Price closed at **₹992.10**, sustaining above the breakout.
* The wedge breakout followed by a strong bullish candle confirms **upward momentum**.
#### 🔹 **Volume Action:**
* Noticeable spike in volume during the breakout — indicating **institutional or strong hands entry**.
* Volume > 1.91M, which is far above the 50-day average, confirming strength.
#### 🔹 **Target Projection:**
* Target = Breakout height added to breakout level
\= ₹907 + ₹258.95 ≈ **₹1,163**
* Marked on chart as **28.64% upside potential**
#### 🔹 **Indicators (Right Panel):**
* **EMA Trend**: All EMAs (8, 21, 55, 144) are rising — bullish alignment.
---
### 🔍 **Levels to Watch:**
| Type | Price (₹) |
| ---------------------- | --------- |
| **Breakout Level** | 907.00 |
| **Current Price** | 992.10 |
| **Resistance/Target** | 1,163.00 |
| **Support Zone** | 907–925 |
| **Volume Spike Price** | \~900–930 |
---
### ✅ **Conclusion:**
SHAKTIPUMP is showing a **textbook falling wedge breakout** with heavy volume. The target stands at **₹1,163**, offering a potential **17%+ upside** from current levels. As long as it holds above ₹907–925, the bullish structure remains intact.
---
### 📊 **Technical Summary:**
#### 🔹 **Chart Pattern:**
* A **falling wedge** breakout occurred **within a broader rectangular consolidation** (boxed range).
* The breakout zone was near **₹907**, and the stock has since surged past the key resistance.
#### 🔹 **Breakout Confirmation:**
* Price closed at **₹992.10**, sustaining above the breakout.
* The wedge breakout followed by a strong bullish candle confirms **upward momentum**.
#### 🔹 **Volume Action:**
* Noticeable spike in volume during the breakout — indicating **institutional or strong hands entry**.
* Volume > 1.91M, which is far above the 50-day average, confirming strength.
#### 🔹 **Target Projection:**
* Target = Breakout height added to breakout level
\= ₹907 + ₹258.95 ≈ **₹1,163**
* Marked on chart as **28.64% upside potential**
#### 🔹 **Indicators (Right Panel):**
* **EMA Trend**: All EMAs (8, 21, 55, 144) are rising — bullish alignment.
---
### 🔍 **Levels to Watch:**
| Type | Price (₹) |
| ---------------------- | --------- |
| **Breakout Level** | 907.00 |
| **Current Price** | 992.10 |
| **Resistance/Target** | 1,163.00 |
| **Support Zone** | 907–925 |
| **Volume Spike Price** | \~900–930 |
---
### ✅ **Conclusion:**
SHAKTIPUMP is showing a **textbook falling wedge breakout** with heavy volume. The target stands at **₹1,163**, offering a potential **17%+ upside** from current levels. As long as it holds above ₹907–925, the bullish structure remains intact.
---
Clause de non-responsabilité
Les informations et les publications ne sont pas destinées à être, et ne constituent pas, des conseils ou des recommandations en matière de finance, d'investissement, de trading ou d'autres types de conseils fournis ou approuvés par TradingView. Pour en savoir plus, consultez les Conditions d'utilisation.