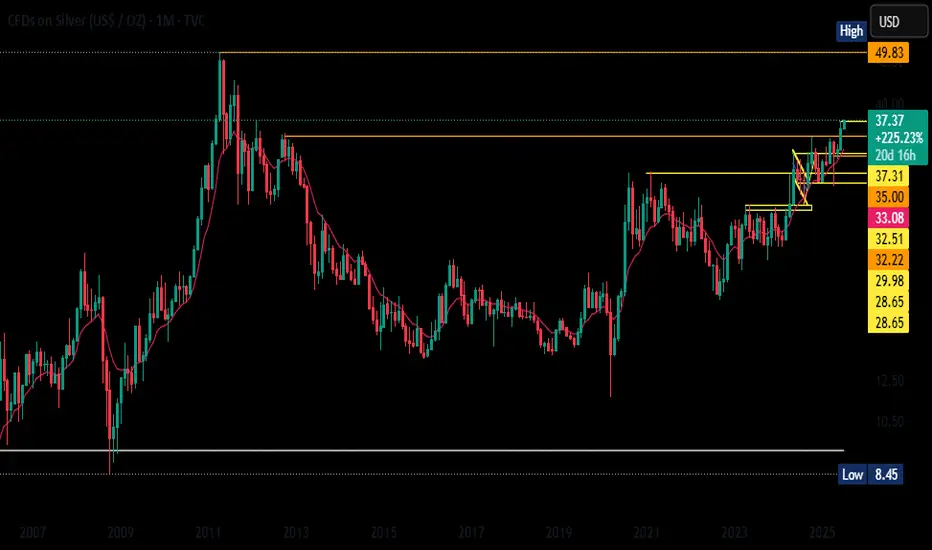
Look at the monthly chart of Silver (CFDs in USD/OZ), the longterm trend is clearly bullish. After spending over a decade consolidating below the $30–35 zone, The breakout above this historical resistance is significant and shows strong momentum, especially with price holding well above the 10-month EMA. We’re currently testing the $37.31 level, and if that gets taken out cleanly, the next major target is the all-time high at $49.83 from 2011. The recent structure even resembles a cup-and-handle or ascending triangle pattern, adding more weight to the bullish case. Support zones are now layered at $35, $33.06, and $32.51—key levels that were previous resistances. If there's any dip back to those zones, it may offer a solid buy-on-dips opportunity. As long as Silver holds above $35 on the monthly chart, I stay bullish with eyes on a move toward the $49.83 zone.
Clause de non-responsabilité
Les informations et les publications ne sont pas destinées à être, et ne constituent pas, des conseils ou des recommandations en matière de finance, d'investissement, de trading ou d'autres types de conseils fournis ou approuvés par TradingView. Pour en savoir plus, consultez les Conditions d'utilisation.