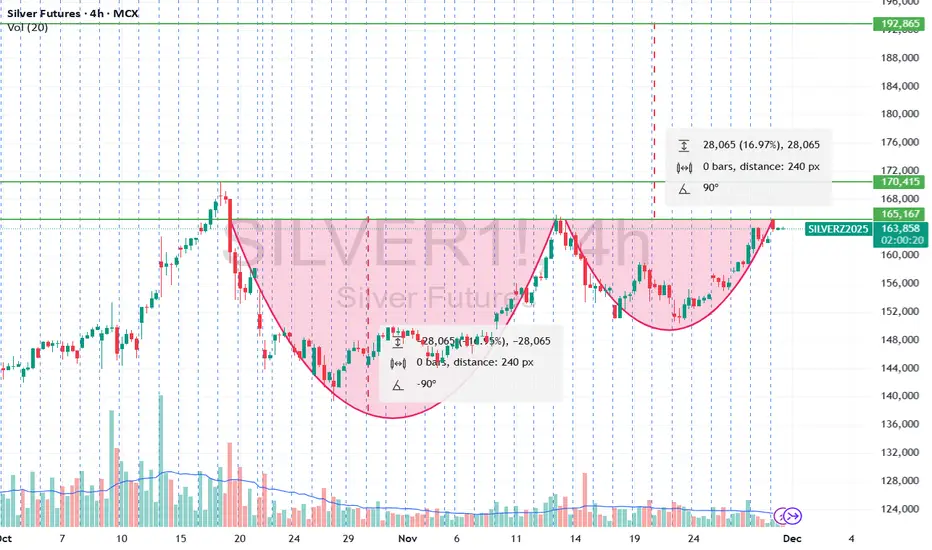
✅ 1. Pattern Type: Double Cup (Twin Cup) With Horizontal Neckline
Your chart shows:
✔️ Two large rounded bottoms
✔️ Both bottoms reach nearly the same support area
✔️ Upside rejections happen at nearly the same level
✔️ A single flat resistance line (neckline) at ~165,100 – 170,400 zone
This is a very bullish basing structure.
✅ 2. Why this pattern is powerful
A single cup & handle is already a bullish pattern.
But you have two consecutive cups, meaning:
🔥 Strong accumulation
🔥 Repeated buying interest at lower levels
🔥 Sellers getting weaker on each test
🔥 Smart money accumulation phase
This is NOT random — it shows institutions loading positions over weeks.
✅ 3. Understanding the Structure
⭕ First Cup
Sharp fall
Long rounded bottom
Gradual rise to neckline
Heavy accumulation region
⭕ Second Cup
Pullback
Higher low compared with first cup → bullish sign
Final rally toward neckline
Volume starts increasing → breakout pressure building
✔ Neckline (Major Resistance): ~165,000–170,400
This is the critical breakout level.
Price tested the neckline three times.
Every time sellers pushed it down — but with reduced strength.
This often indicates:
➡ Buyers are absorbing all sell orders
➡ Breakout is only a matter of time
✅ 4. Target Projection (Breakout Target)
You have already plotted the measurement correctly:
Cup Depth = ~28,065 points (16.97%)
Classic Cup & Handle breakout rule:
📌 Breakout Target = Neckline + Cup Depth
If breakout occurs above ~170,400, then:
🎯 Target = 170,400 + 28,065 = ~198,500
Your chart shows similar levels (192,865 is conservative target).
198k is extended target.
✅ 5. What must happen next? (Breakout Conditions)
✔ Strong candle close above neckline (no wick rejection)
✔ Volume spike confirming buyer dominance
✔ Retest of neckline as support (optional but ideal)
✔ Follow-through higher highs
If breakout is real, Silver can trend strongly for weeks.
✅ 6. Failure Conditions (Invalidation)
Pattern fails if:
❌ Price closes below second cup bottom
(around 147,000 – 150,000 area)
That would indicate breakdown from accumulation → turning into distribution.
But right now, price is bullish.
✅ 7. Market Psychology Behind the Pattern
This pattern tells a story:
1️⃣ First Cup = Panic selling → slow accumulation
2️⃣ Resistance rejection = Profit booking
3️⃣ Second Cup = Higher low → buyers stronger
4️⃣ Repeated top rejections = sellers weakening
5️⃣ Breakout = Markup phase begins
This is how smart money loads positions quietly and then drives the breakout.
✅ 8. Trading Strategy
🔥 Aggressive Entry
Enter on breakout strong candle above 170,400.
🔥 Conservative Entry
Wait for retest of neckline:
Price breaks above
Comes back to test support
Holds
Then go long
Stop Loss
Below second-cup mid-point (~158,000–160,000 region).
Targets
T1: 178,000
T2: 185,000
T3: 192,865 (your marked target)
Extended: 198,500
Clause de non-responsabilité
Les informations et publications ne sont pas destinées à être, et ne constituent pas, des conseils ou recommandations financiers, d'investissement, de trading ou autres fournis ou approuvés par TradingView. Pour en savoir plus, consultez les Conditions d'utilisation.
Clause de non-responsabilité
Les informations et publications ne sont pas destinées à être, et ne constituent pas, des conseils ou recommandations financiers, d'investissement, de trading ou autres fournis ou approuvés par TradingView. Pour en savoir plus, consultez les Conditions d'utilisation.