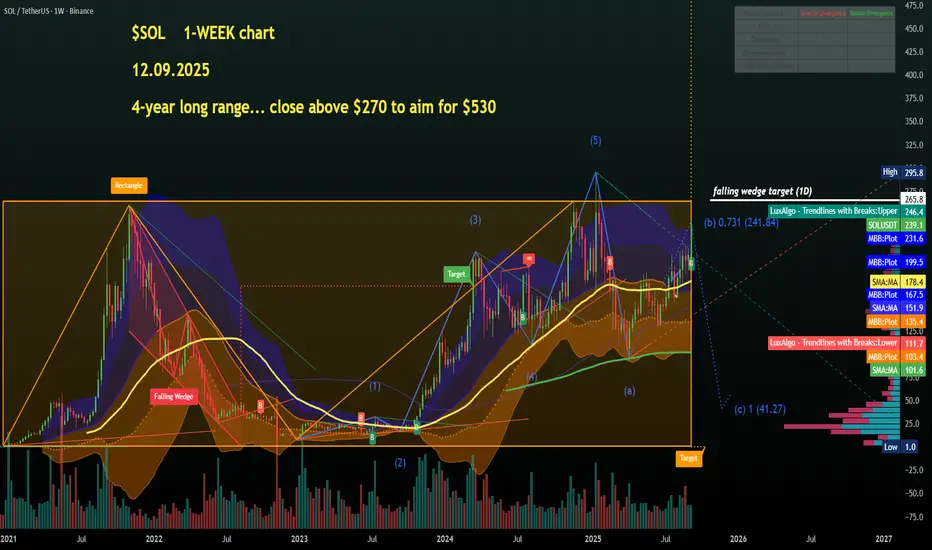
So, first of all a huge range since the beginning of 2021, let's call that a rectangle pattern giving us a clear long-term breakout level on weekly candle close above $265-$275, the higher the better.
RSI upcurved nicely at 66 so plenty of room to grow in Q4.
From there we would have a target of around $525, not unrealistic. Daily view next💙👽☝️
Clause de non-responsabilité
Les informations et publications ne sont pas destinées à être, et ne constituent pas, des conseils ou recommandations financiers, d'investissement, de trading ou autres fournis ou approuvés par TradingView. Pour en savoir plus, consultez les Conditions d'utilisation.
Clause de non-responsabilité
Les informations et publications ne sont pas destinées à être, et ne constituent pas, des conseils ou recommandations financiers, d'investissement, de trading ou autres fournis ou approuvés par TradingView. Pour en savoir plus, consultez les Conditions d'utilisation.