Technical Analysis and Outlook:
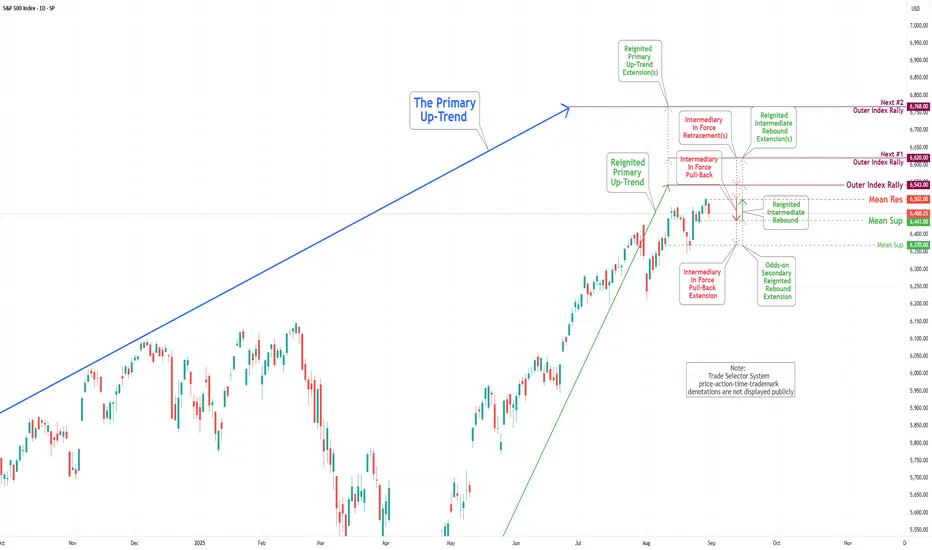
During the trading activities of the previous week, the S&P 500 Index demonstrated significant downward price movements before indicating a recovery. It reestablished its upward trend by retesting the Mean Resistance level of 6470 and trading above this benchmark. Following this, the Index exhibited a strong pivot, leading to the establishment of a new Mean Resistance at 6502.
Currently, the objective is to reach our Mean Support target, set at 6441. It is crucial to acknowledge that once this Mean Support level is achieved, there exists a substantial likelihood of a robust rebound aimed at the long-term target, the Outer Index Rally at 6543, facilitated by the Mean Resistance of 6502. Conversely, there is a potential scenario involving a significant pullback to the Mean Support level of 6370, which an odds-on secondary rebound would follow.
Publications connexes
Clause de non-responsabilité
Les informations et les publications ne sont pas destinées à être, et ne constituent pas, des conseils ou des recommandations en matière de finance, d'investissement, de trading ou d'autres types de conseils fournis ou approuvés par TradingView. Pour en savoir plus, consultez les Conditions d'utilisation.