How to Trade the Double Top Pattern Like a Pro
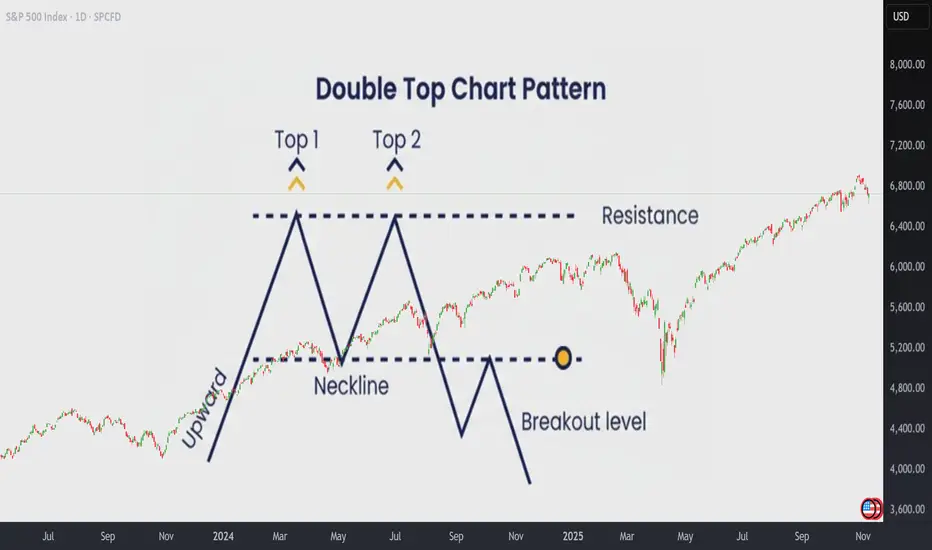
The Double Top is one of the most reliable patterns in technical analysis. It often marks the beginning of a resistance zone and signals that bullish momentum is losing strength.
The first top is hard to anticipate, it’s usually just a continuation of the existing rally. But when the second top fails to break above the previous high, that’s when things get interesting. This failure creates a resistance level, and it’s the first warning sign that buyers may be running out of steam.
🔵 Why Do Double Tops Form?
There are usually two main reasons why a Double Top appears:
Learning to tell which case you’re facing can help you decide whether it’s a great buying opportunity during a healthy pullback, or a signal to take profits, or even go short.
🧭 Step 1: How to Identify a Real Double Top
Before trading it, make sure it’s a true Double Top:
- Both peaks must form after a strong upward move. If the market was falling before, it’s not a classic pattern.
- The two tops should be at almost the same price level (no more than a 0.5% difference).
- The most important part is the neckline, the lowest point between the two tops.
That neckline defines whether the move is just a healthy pullback or the beginning of a new downtrend.
If the neckline doesn’t break, there is no Double Top yet.
The pattern is only confirmed after the neckline breaks downward.
💥 Step 2: Trading the Pattern
There are three main scenarios to understand:
1️⃣ A Confirmed Double Top (Breaks Down)
When the neckline breaks, the market often drops about 61.8% of the pattern’s height, with a probability above 70%.
A small pullback to retest the neckline is possible, but usually, the price won’t return to the previous highs.
A Double Top is spotted:

The neckline is broken:

A decline happens sharply:

2️⃣ A Fake Double Top (Break Fails)
If the price fails to break the neckline and instead makes new highs, it’s not a real Double Top.
This typically means we’re in a profit-taking phase, not a trend reversal.
In these cases, it’s often best to stay out, as the market tends to move sideways or show mixed signals.
A spotted double Top:

Fails to break down, instead breaks up:

The rally unfolds:

3️⃣ A Double Top Trap in a Strong Bull Market
Sometimes, a small break below the neckline triggers stops before the price explodes higher again.
These are common during powerful bull runs.
A spotted double Top:

The neckline is broken:

Inmediately the price reverse and break upwards.

The price rallies:

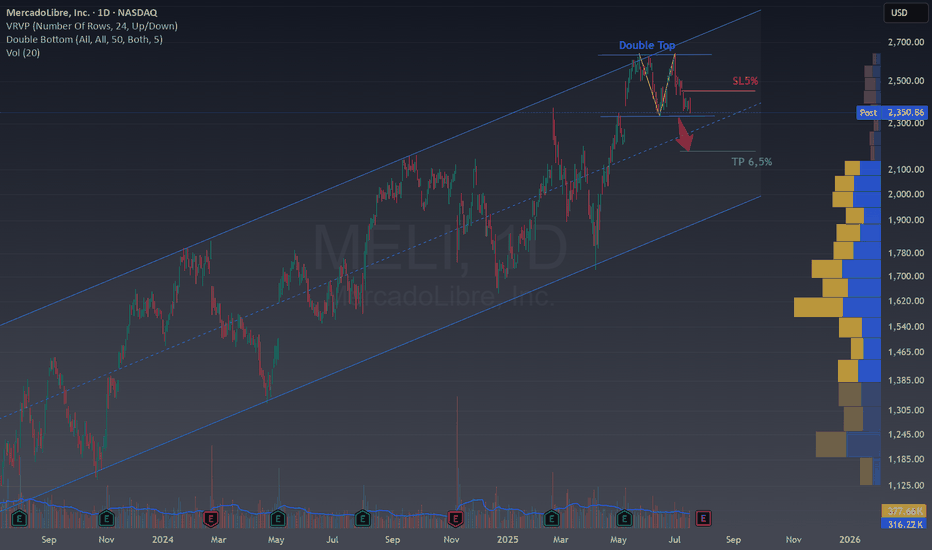
💲Real Double Tops:
Theory is simportant, but let's go real!
A Double Top is now unfolding in Microsoft, and as you can see the neckline is almost there! Is this a signal? Wil a fake breakout occur? Are we witnesing the end of AI rally?
https://www.tradingview.com/x/fe7drXb4/
And some previous Double Tops:

❗A final recommendation
Tradingview offers a great indicator to Spot Double Top patterns easily.
Once you are in a chart, click on indicators and search Double Top Chart Pattern indicator. It's only for paid users and works fine!
Take a look how it spots the Double Top pattern and also gives you and idea of the posible target price!

Or the current one in MSFT
MSFT

In short:
Double Tops work roughly 70% of the time, but context matters.
They perform best in sideways or slowing markets, and are less reliable in strong rallies, where false breaks can easily trap traders.
Always confirm the neckline break, watch for volume, and never forget:
A pattern is just a probability, not a guarantee.
The Double Top is one of the most reliable patterns in technical analysis. It often marks the beginning of a resistance zone and signals that bullish momentum is losing strength.
The first top is hard to anticipate, it’s usually just a continuation of the existing rally. But when the second top fails to break above the previous high, that’s when things get interesting. This failure creates a resistance level, and it’s the first warning sign that buyers may be running out of steam.
🔵 Why Do Double Tops Form?
There are usually two main reasons why a Double Top appears:
- Profit-taking after a strong rally.Bulls start to lock in profits, causing the momentum to fade.
- Lack of new buyers. Demand weakens, and bears begin to take control gradually.
Learning to tell which case you’re facing can help you decide whether it’s a great buying opportunity during a healthy pullback, or a signal to take profits, or even go short.
🧭 Step 1: How to Identify a Real Double Top
Before trading it, make sure it’s a true Double Top:
- Both peaks must form after a strong upward move. If the market was falling before, it’s not a classic pattern.
- The two tops should be at almost the same price level (no more than a 0.5% difference).
- The most important part is the neckline, the lowest point between the two tops.
That neckline defines whether the move is just a healthy pullback or the beginning of a new downtrend.
If the neckline doesn’t break, there is no Double Top yet.
The pattern is only confirmed after the neckline breaks downward.
💥 Step 2: Trading the Pattern
There are three main scenarios to understand:
1️⃣ A Confirmed Double Top (Breaks Down)
When the neckline breaks, the market often drops about 61.8% of the pattern’s height, with a probability above 70%.
A small pullback to retest the neckline is possible, but usually, the price won’t return to the previous highs.
A Double Top is spotted:
The neckline is broken:
A decline happens sharply:
2️⃣ A Fake Double Top (Break Fails)
If the price fails to break the neckline and instead makes new highs, it’s not a real Double Top.
This typically means we’re in a profit-taking phase, not a trend reversal.
In these cases, it’s often best to stay out, as the market tends to move sideways or show mixed signals.
A spotted double Top:
Fails to break down, instead breaks up:
The rally unfolds:
3️⃣ A Double Top Trap in a Strong Bull Market
Sometimes, a small break below the neckline triggers stops before the price explodes higher again.
These are common during powerful bull runs.
A spotted double Top:
The neckline is broken:
Inmediately the price reverse and break upwards.
The price rallies:
💲Real Double Tops:
Theory is simportant, but let's go real!
A Double Top is now unfolding in Microsoft, and as you can see the neckline is almost there! Is this a signal? Wil a fake breakout occur? Are we witnesing the end of AI rally?
https://www.tradingview.com/x/fe7drXb4/
And some previous Double Tops:
❗A final recommendation
Tradingview offers a great indicator to Spot Double Top patterns easily.
Once you are in a chart, click on indicators and search Double Top Chart Pattern indicator. It's only for paid users and works fine!
Take a look how it spots the Double Top pattern and also gives you and idea of the posible target price!
Or the current one in
In short:
Double Tops work roughly 70% of the time, but context matters.
They perform best in sideways or slowing markets, and are less reliable in strong rallies, where false breaks can easily trap traders.
Always confirm the neckline break, watch for volume, and never forget:
A pattern is just a probability, not a guarantee.
⚡ Trading is not about luck or patience. Is about skills and knowledge. ⚡
I share my ideas, returns and knowledge here:
📚 👉 topchartpatterns.substack.com/subscribe 👈📚
🤝 Business contact: info@topchartpatterns.com
I share my ideas, returns and knowledge here:
📚 👉 topchartpatterns.substack.com/subscribe 👈📚
🤝 Business contact: info@topchartpatterns.com
Publications connexes
Clause de non-responsabilité
Les informations et publications ne sont pas destinées à être, et ne constituent pas, des conseils ou recommandations financiers, d'investissement, de trading ou autres fournis ou approuvés par TradingView. Pour en savoir plus, consultez les Conditions d'utilisation.