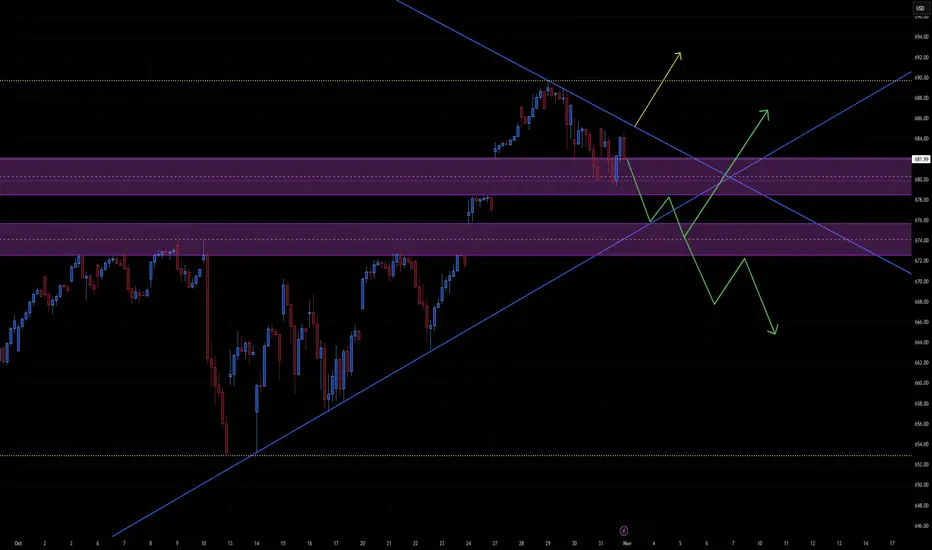
The chart shows SPY (S&P 500 ETF) with:
Descending resistance trendline from recent highs
Ascending support trendline from the October lows
Two horizontal demand/supply zones around 675–678 and 680–684
Potential breakout and breakdown paths (yellow and green arrows)
This suggests you’re analyzing a symmetrical triangle or descending channel meeting an ascending trend, which typically resolves with a directional breakout soon.
📈 Bullish Case (Yellow Path)
Setup:
Price currently around 681–682, testing the upper supply zone and descending trendline.
Confirmation Needed:
Break and close above 684–686 (top of purple zone and descending resistance)
Hold that level as new support
Target Zones:
690–692 — measured move from the triangle and prior local resistance
700+ — if momentum builds on macro catalysts (earnings, rates, etc.)
Bullish Catalysts:
VIX cooling off, risk-on sentiment
Strong earnings / dovish Fed remarks
Volume-supported breakout above 684
Invalidation:
Failure to hold above 678 after breakout retest
📉 Bearish Case (Green Path)
Setup:
Rejection from the 681–684 resistance area and continuation under descending resistance.
Confirmation Needed:
Breakdown below 676, invalidating the ascending support trendline
Lower high confirmation near 681
Target Zones:
670–672 — first reaction zone (lower purple band)
662–664 — measured move from descending wedge
650–654 — extended target (matches prior low and yellow dotted support)
Bearish Catalysts:
Rising yields or hawkish Fed tone
Weak labor/inflation data
Broad risk-off correction
Invalidation:
Break above 686–688 with volume
⚖️ Neutral Outlook (Next 2–3 Weeks)
SPY is coiling tightly between 676 and 684, and volatility compression suggests a breakout likely within 1–2 weeks.
The key pivot is 680–682: above it favors short-term bulls; below 676 shifts momentum bearish.
🧩 Summary Table
Bias Confirmation Short-term Target Stop/Invalidation Notes
Bullish Close above 684 690–692 <678 Momentum breakout scenario
Bearish Close below 676 670 → 662 >686 Breakdown from wedge
Neutral Range 676–684 — — Wait for breakout confirmation
Clause de non-responsabilité
Les informations et les publications ne sont pas destinées à être, et ne constituent pas, des conseils ou des recommandations en matière de finance, d'investissement, de trading ou d'autres types de conseils fournis ou approuvés par TradingView. Pour en savoir plus, consultez les Conditions d'utilisation.