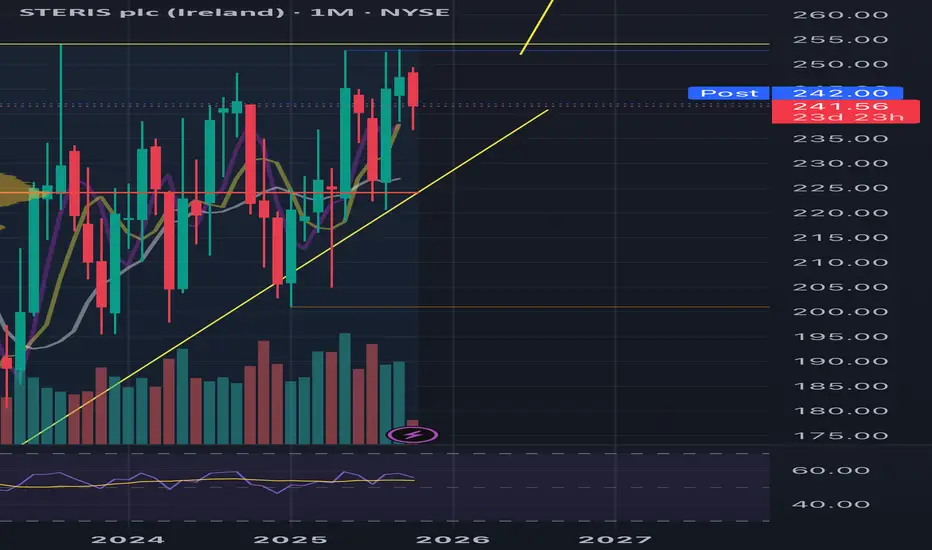
"STERIS plc (STE) monthly chart shows a classic bullish setup: after a strong long-term rally, the stock formed an ascending triangle pattern with rising lows and a strong resistance above. If  STE breaks out above resistance, the theoretical target—projecting the height of the pattern from the breakout zone—would be in the 335-350 range. Pattern confirmation and volume are key for trend continuation.
Clause de non-responsabilité
Les informations et les publications ne sont pas destinées à être, et ne constituent pas, des conseils ou des recommandations en matière de finance, d'investissement, de trading ou d'autres types de conseils fournis ou approuvés par TradingView. Pour en savoir plus, consultez les Conditions d'utilisation.