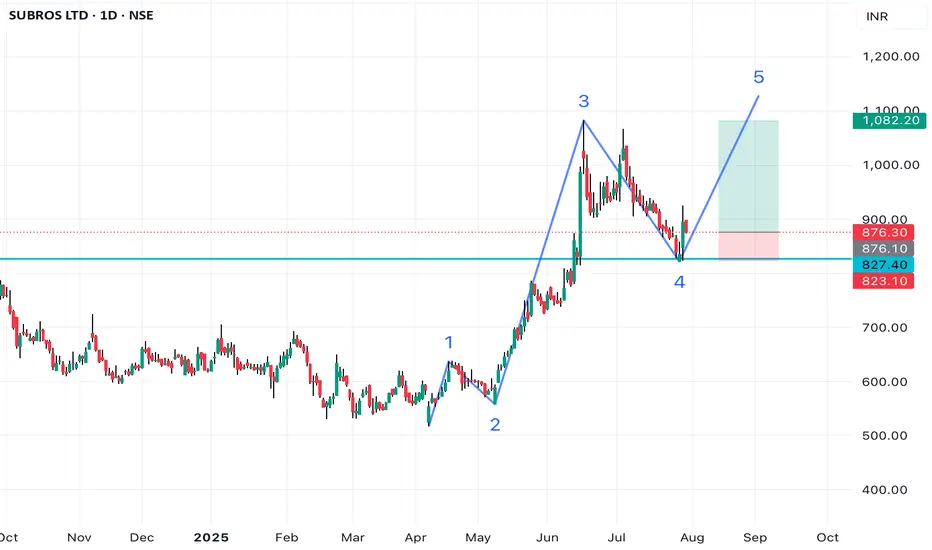
The stock is in clear uptrend on higher time frames (Weekly & Monthly).
It has given a break out on weekly time frame and now has come to retest the same level.
In daily TF we can see the bullish candle on support and a corrective wave (A-B-C).
It has also taken support on 50 EMA.
So the confluence of the 2 context gives some conviction on this chart. If NIFTY goes up then the chances of this stock going up increase dramatically.
NOTE: Pls do not take this as an advice, Just sharing my study.
Clause de non-responsabilité
Les informations et publications ne sont pas destinées à être, et ne constituent pas, des conseils ou recommandations financiers, d'investissement, de trading ou autres fournis ou approuvés par TradingView. Pour en savoir plus, consultez les Conditions d'utilisation.
Clause de non-responsabilité
Les informations et publications ne sont pas destinées à être, et ne constituent pas, des conseils ou recommandations financiers, d'investissement, de trading ou autres fournis ou approuvés par TradingView. Pour en savoir plus, consultez les Conditions d'utilisation.